Unit 5 - Notes
Unit 5: Incident Response, Monitoring, and Indicators of Malicious Activity
1. Incident Response (IR)
Incident Response is the organized approach to addressing and managing the aftermath of a security breach or cyberattack. The goal is to handle the situation in a way that limits damage and reduces recovery time and costs.
Key Terminology
- Event: Any observable occurrence in a system or network (e.g., a user connecting to a file share).
- Incident: An event that violates security policies or poses a threat (e.g., a user accessing unauthorized confidential files).
- CSIRT (Computer Security Incident Response Team): The designated group of professionals responsible for handling security incidents.
The NIST Incident Response Life Cycle (SP 800-61)
The industry standard for IR follows a four-phase cycle. It is continuous, emphasizing that lessons learned drive future preparation.
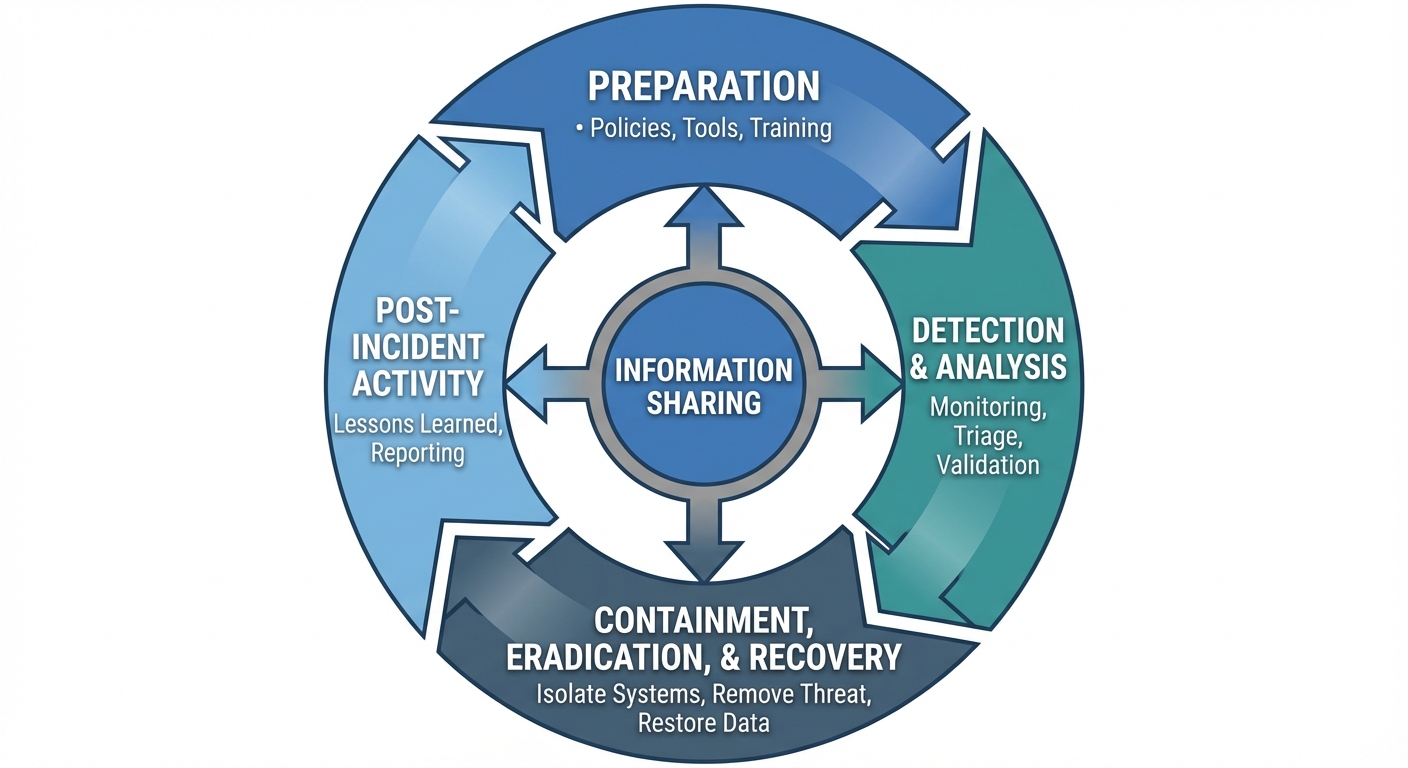
- Preparation:
- Establishing policies and procedures.
- Setting up communication channels.
- Acquiring tools (forensics software, clean laptops).
- Training the CSIRT.
- Detection and Analysis:
- Monitoring logs and alerts.
- Triage: Determining if an event is a false positive or a true incident.
- Prioritization based on impact and recoverability.
- Containment, Eradication, and Recovery:
- Containment: Stopping the spread (e.g., disconnecting a server from the internet).
- Eradication: Removing the root cause (e.g., deleting malware, patching vulnerabilities).
- Recovery: Restoring systems to normal operation and monitoring for re-infection.
- Post-Incident Activity:
- conducting a "Lessons Learned" meeting.
- Updating policies and threat intelligence based on the attack.
2. Digital Forensics
Digital forensics involves the preservation, identification, extraction, interpretation, and documentation of computer evidence to be used in a court of law or for internal investigations.
The Forensics Process
- Collection: Identifying and acquiring data without altering it.
- Examination: Processing data (e.g., recovering deleted files).
- Analysis: connecting the evidence to the specific incident.
- Reporting: Presenting findings in a non-technical manner for legal/management review.
Order of Volatility
When collecting evidence, investigators must collect data from the most volatile (fleeting) to the least volatile sources first to prevent data loss.
- CPU Cache, Registers: (Most Volatile - vanish instantly on power loss).
- Routing Table, ARP Cache, Process Table, Kernel Statistics: (Memory resident).
- RAM (Random Access Memory): System memory.
- Temporary File Systems / Swap Space.
- Disk / Hard Drive: (Persistent data).
- Remote Logging / Monitoring Data.
- Archived Media: (Least Volatile - CD/DVDs, Tape backups).
Chain of Custody
A legal document that tracks the movement of evidence. It documents:
- Who handled the evidence.
- When they handled it (date/time).
- What was done with it.
- Where it was stored.
Crucial Concept: If the chain of custody is broken, the evidence is usually inadmissible in court.
3. Data Sources
To detect incidents, security analysts rely on various data sources generated by IT infrastructure.
- Security Logs: Track login attempts (successful and failed), privilege escalation, and file access.
- System Logs: Record system start-up/shutdown, driver failures, and hardware errors.
- Application Logs: specific to software (e.g., SQL database logs, Apache/IIS web server logs).
- Network Traffic (Packet Captures/PCAP): Full recording of the actual data packets crossing the network.
- Flow Data (NetFlow/IPFIX): Metadata about network traffic (Source IP, Destination IP, Port, Protocol, Duration) without the payload content.
- Endpoint Data: Information from desktops/servers regarding running processes, registry changes, and file integrity.
4. Alerting and Monitoring Tools
Organizations use specialized tools to aggregate and analyze the massive volume of data sources.
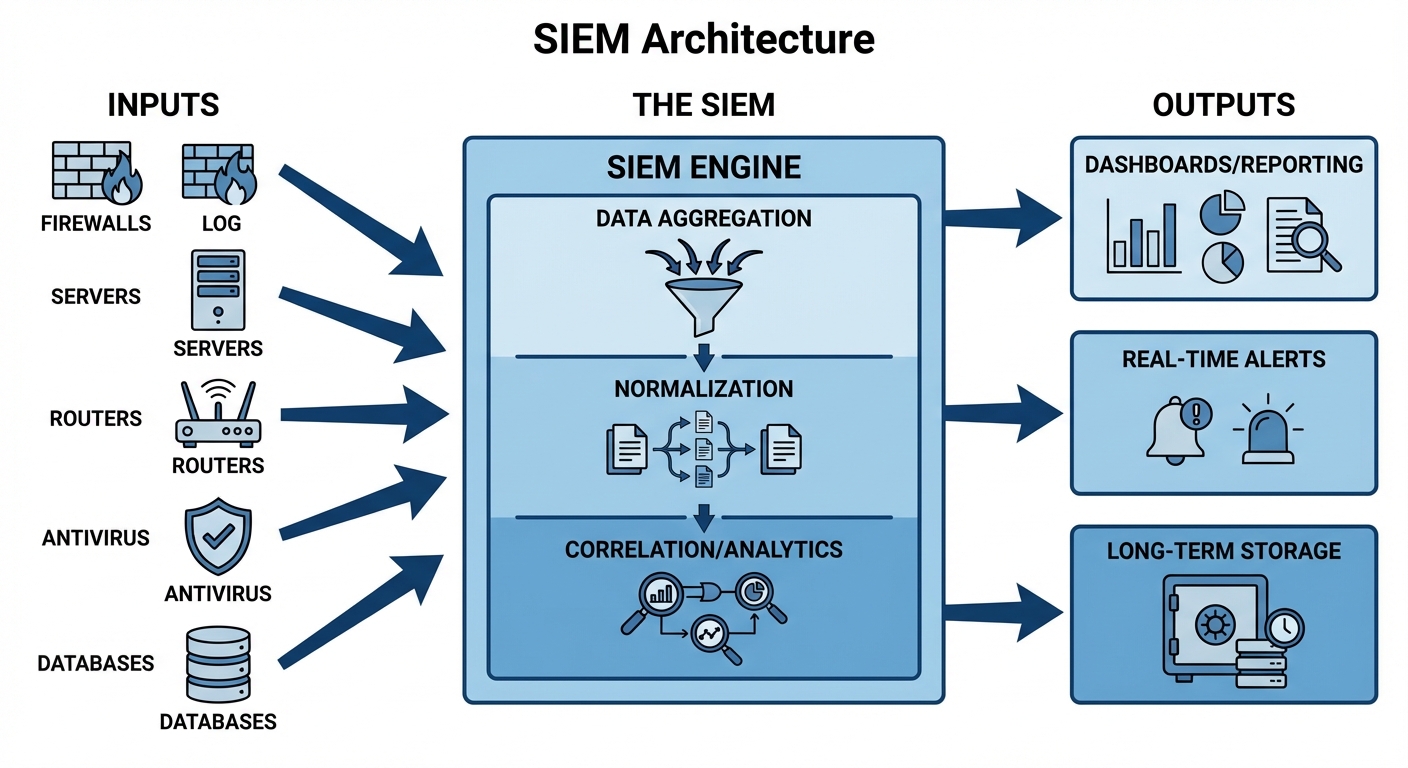
SIEM (Security Information and Event Management)
SIEM tools act as the central brain of security monitoring. They aggregate logs from firewalls, servers, routers, and antivirus software into a single location to correlate events.
- Log Collection: Centralizes data.
- Normalization: Converts different log formats into a standard format.
- Correlation: Links related events (e.g., 5 failed logins on a server followed by a successful login might indicate a brute-force attack).
Other Key Tools
- IDS (Intrusion Detection System): Monitors traffic for malicious patterns. It alerts the analyst but does not stop the traffic.
- IPS (Intrusion Prevention System): Monitors traffic and actively blocks the connection if a threat is detected.
- EDR (Endpoint Detection and Response): Installed on host devices to record behavior and allow remote isolation of infected machines.
- SOAR (Security Orchestration, Automation, and Response): Automates responses to low-level alerts (e.g., automatically blocking an IP address on the firewall without human intervention).
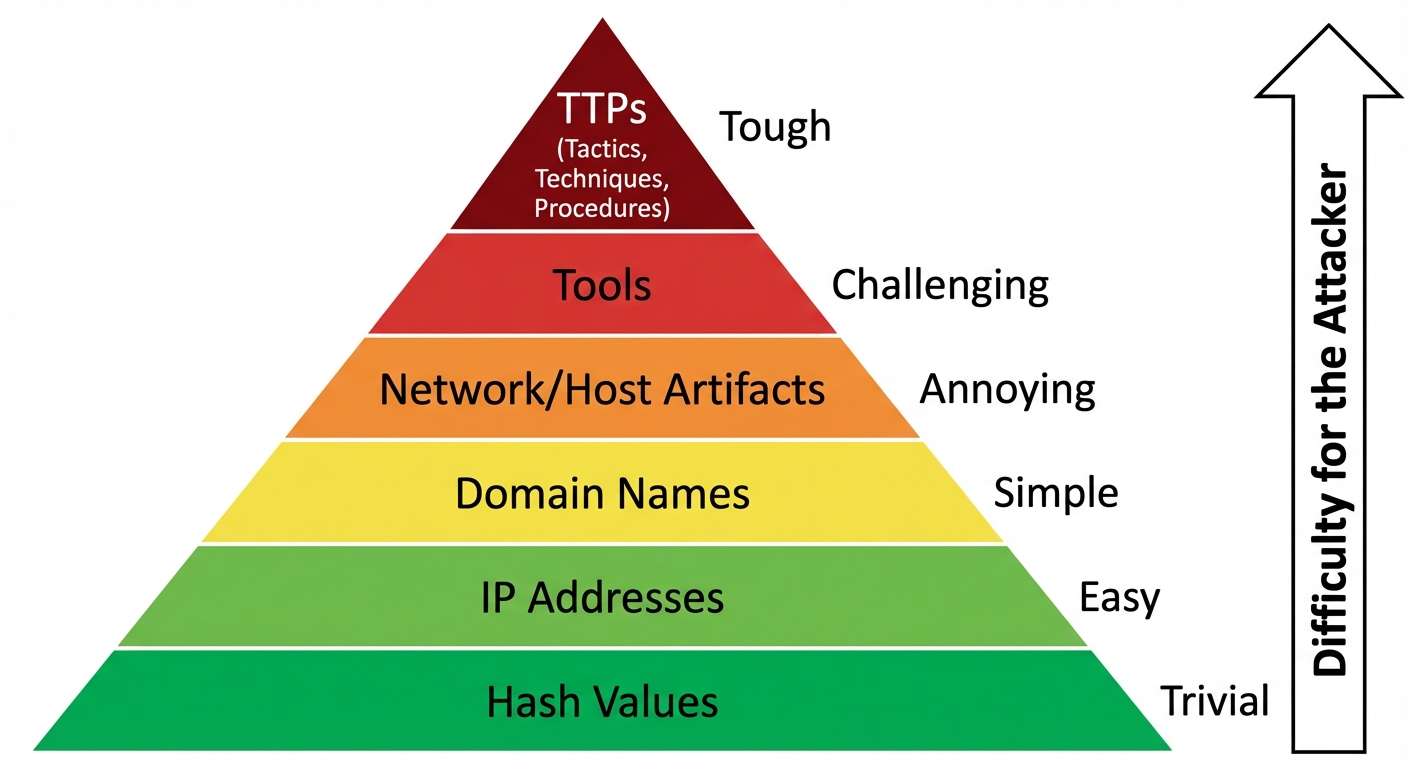
5. Malware Attack Indicators
Indicators of Compromise (IoCs) are pieces of forensic data that identify potentially malicious activity on a system or network.
Common Malware Indicators
- Hash Values: Specific MD5 or SHA-256 file signatures known to be malicious.
- Beaconing: Regular, heartbeat-like network connections to an external Command and Control (C2) server.
- Registry Changes: Modifications to
HKLM\Software\Microsoft\Windows\CurrentVersion\Runto ensure malware starts upon reboot (Persistence). - Unexpected Services: New services running with cryptic names or running from temporary folders (e.g.,
AppData/Local/Temp). - High Resource Usage: Unexpected spikes in CPU or RAM usage (common in Crypto-mining malware).
- Ransomware Signs: Mass file renaming (e.g.,
.locked,.enc), inability to open files, and ransom note text files appearing on the desktop.
6. Physical and Network Attack Indicators
Attacks often manifest in the physical environment or the network layer before an endpoint is fully compromised.
Physical Attack Indicators
- Tailgating: Unauthorized individuals following authorized personnel through secure doors.
- Missing Devices: Laptops, hard drives, or access cards reported lost.
- Tampered Hardware: USB devices plugged into servers, keyloggers attached to keyboards, or evidence of lock picking.
- Rogue Access Points: Unauthorized Wi-Fi routers hidden under desks to bypass network security.
Network Attack Indicators
- Bandwidth Anomalies: Sudden spikes in outbound traffic (indicating data exfiltration) or inbound traffic (indicating a DDoS attack).
- Lateral Movement: Traffic between internal user workstations (which usually shouldn't communicate directly with each other).
- Geographical Irregularities: Traffic originating from or destined to countries where the organization does not do business.
- Port Scanning: A single IP address attempting to connect to multiple sequential ports on a target server.
7. Application Attack Indicators
Web applications are frequent targets. Security analysts monitor HTTP traffic and server logs for these specific signs.
- SQL Injection (SQLi) Indicators:
- Logs showing special characters in input fields:
',--,OR 1=1,UNION SELECT. - Database errors revealed to the user.
- Logs showing special characters in input fields:
- Cross-Site Scripting (XSS) Indicators:
- Input fields containing HTML or JavaScript tags:
<script>,alert(),document.cookie. - URLs containing long, encoded strings (e.g.,
%3Cscript%3E).
- Input fields containing HTML or JavaScript tags:
- Directory Traversal:
- URL requests containing
../or..\attempts to access root directories (e.g.,GET /images/../../../../etc/passwd).
- URL requests containing
- Password Spraying / Brute Force:
- Application logs showing hundreds of failed login attempts for a single account (Brute Force).
- Logs showing a single password attempted against hundreds of different usernames (Password Spraying).