Unit 3 - Notes
Unit 3: Components of a Business Plan
A business plan is a formal roadmap that outlines a business's goals and the strategy for reaching them. While the Executive Summary provides the overview, the core operational viability of the business is defined by four specific functional plans: Marketing, Human Resources, Operations, and Finance.
1. The Marketing Plan
The Marketing Plan details how a company will attract and retain customers. It moves beyond simple advertising to encompass the entire strategy for product placement, pricing, and market positioning.
A. Market Analysis
Before selling, the entrepreneur must understand the landscape.
- Target Market Definition: Identifying the specific demographic, psychographic, and geographic profile of the ideal customer (e.g., "Urban professionals aged 25-35 earning over $60k").
- Market Size:
- TAM (Total Addressable Market): The total revenue opportunity available for a product.
- SAM (Serviceable Available Market): The segment of the TAM targeted by your products which is within your geographical reach.
- SOM (Serviceable Obtainable Market): The portion of SAM that you can capture.
B. Competitive Analysis
- Direct Competitors: Businesses offering the same product/service.
- Indirect Competitors: Businesses offering different solutions to the same problem.
- SWOT Analysis: Assessing Strengths, Weaknesses (Internal) and Opportunities, Threats (External).
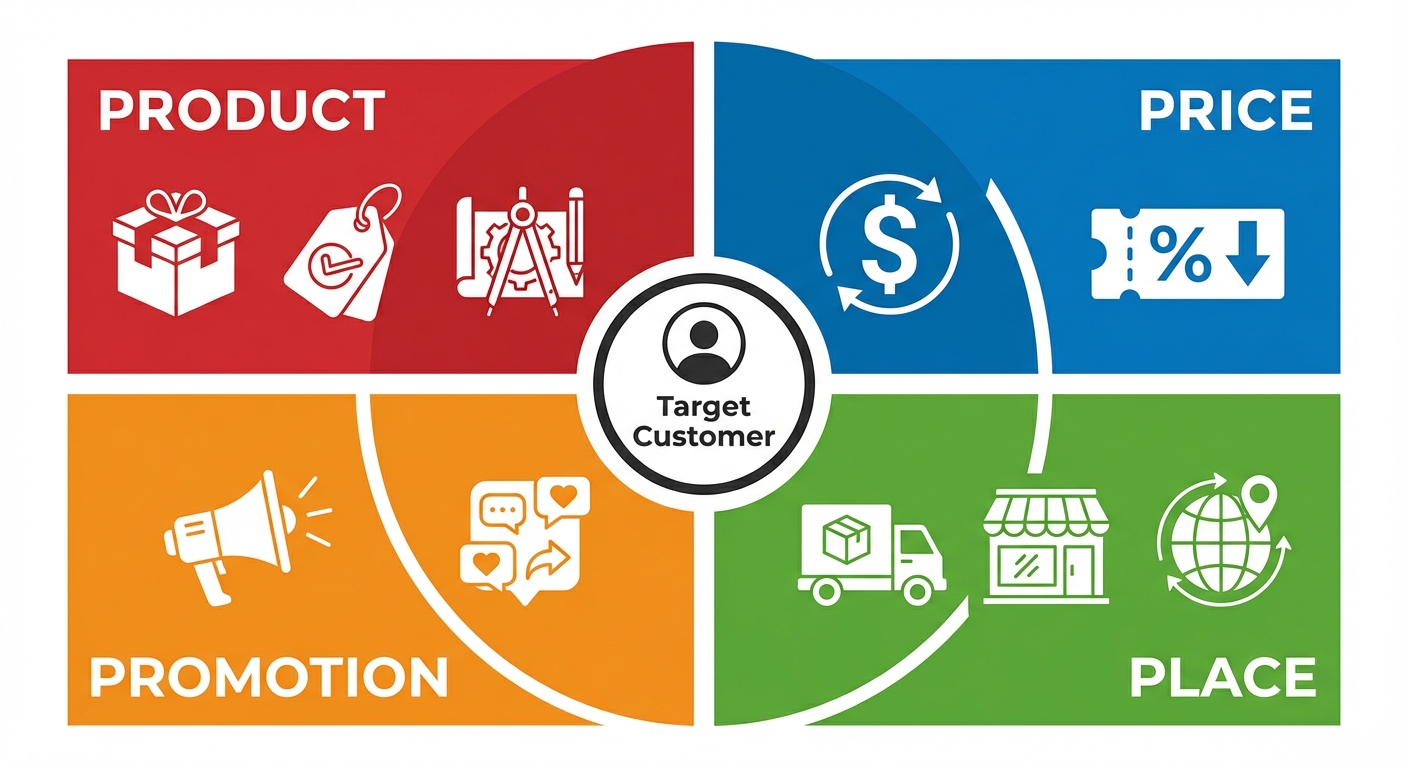
C. The Marketing Mix (The 4 Ps)
This is the tactical execution of the marketing strategy.
- Product: Features, quality, branding, packaging, and USP (Unique Selling Proposition).
- Price: Strategy used (Cost-plus, Value-based, Penetration pricing, Skimming).
- Place: Distribution channels (Direct-to-consumer, Retail, Wholesalers, eCommerce).
- Promotion: Marketing communications (Social media, PR, Sales promotion, SEO).
D. Sales Strategy
- Sales Cycle: The process from lead generation to closing the deal.
- Sales Forecast: Monthly or quarterly projections of sales volume based on marketing efforts.
2. The Human Resource (HR) Plan
The HR Plan demonstrates that the business has the right team to execute the strategy. Investors often invest in the people more than the idea.
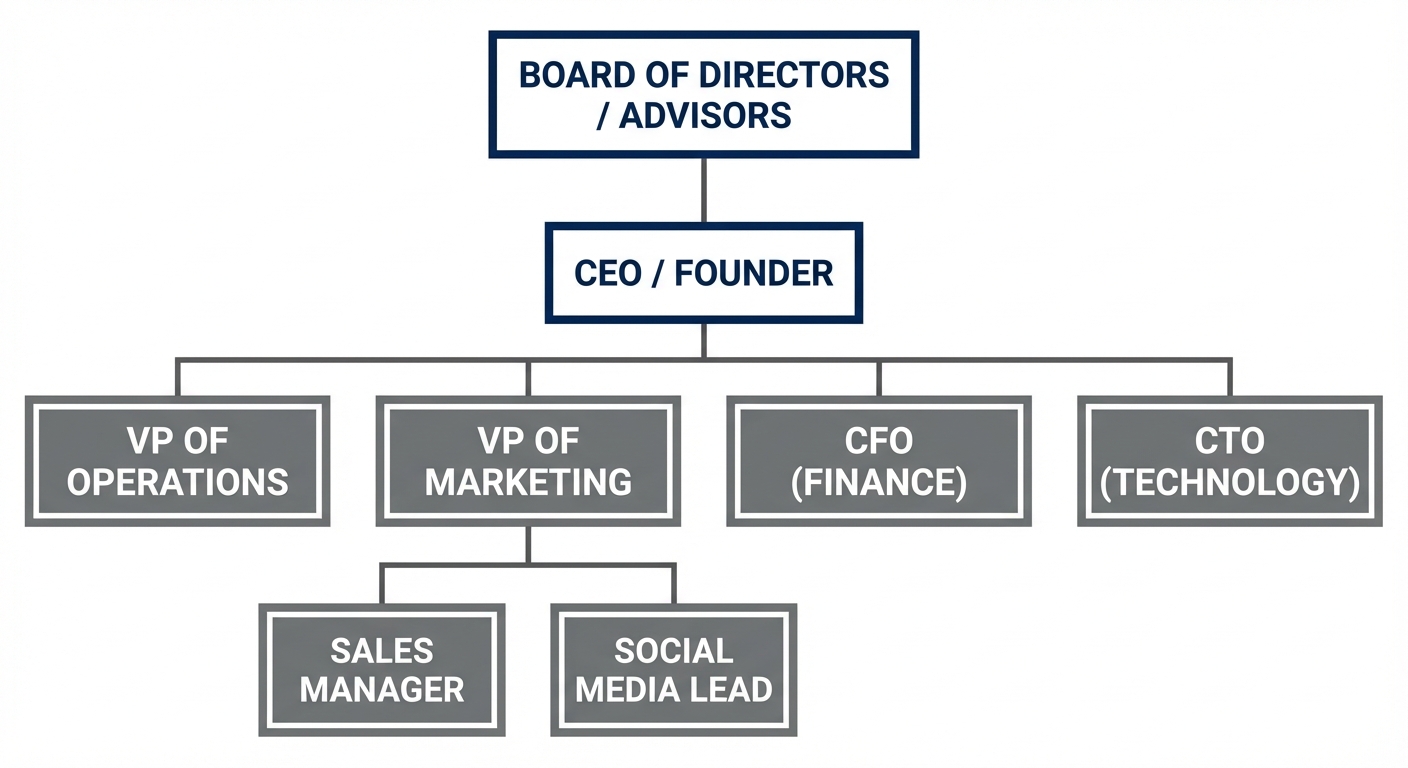
A. Organizational Structure
This defines the hierarchy and reporting lines within the company. It clarifies who is responsible for what and how communication flows.
- Sole Proprietorship: Simple structure, owner makes all decisions.
- Functional Structure: Divided by department (Marketing, Finance, Ops).
- Matrix Structure: Employees report to both a functional manager and a project manager.
B. Management Team
- Key Personnel: Profiles of the founders and senior managers, highlighting relevant experience and past successes.
- Advisory Board: External experts who provide guidance (mentors, industry veterans).
C. Staffing and Recruitment
- Gap Analysis: Current skills vs. required skills.
- Recruitment Strategy: Where talent will be sourced (LinkedIn, Universities, Headhunters).
- Onboarding: Training processes for new hires.
D. Compensation and Policies
- Remuneration: Salary, equity (stock options), and benefits packages.
- Legal Compliance: Adherence to labor laws, contracts, and workplace safety regulations.
3. The Operations Plan
The Operations Plan outlines the "how" of the business—the daily processes required to deliver the product or service to the customer.
A. Production Process / Service Delivery
- Workflow: The step-by-step process of transforming raw materials into finished goods.
- Outsourcing vs. In-house: Decisions on what to build internally versus what to buy or contract out.
- Quality Control: Mechanisms to ensure consistent standards (e.g., ISO certification, random testing).
B. Facilities and Location
- Physical Location: Retail visibility vs. warehouse utility.
- Lease vs. Buy: Financial implications of property acquisition.
- Layout: Efficiency of floor plan (e.g., kitchen layout for a restaurant).
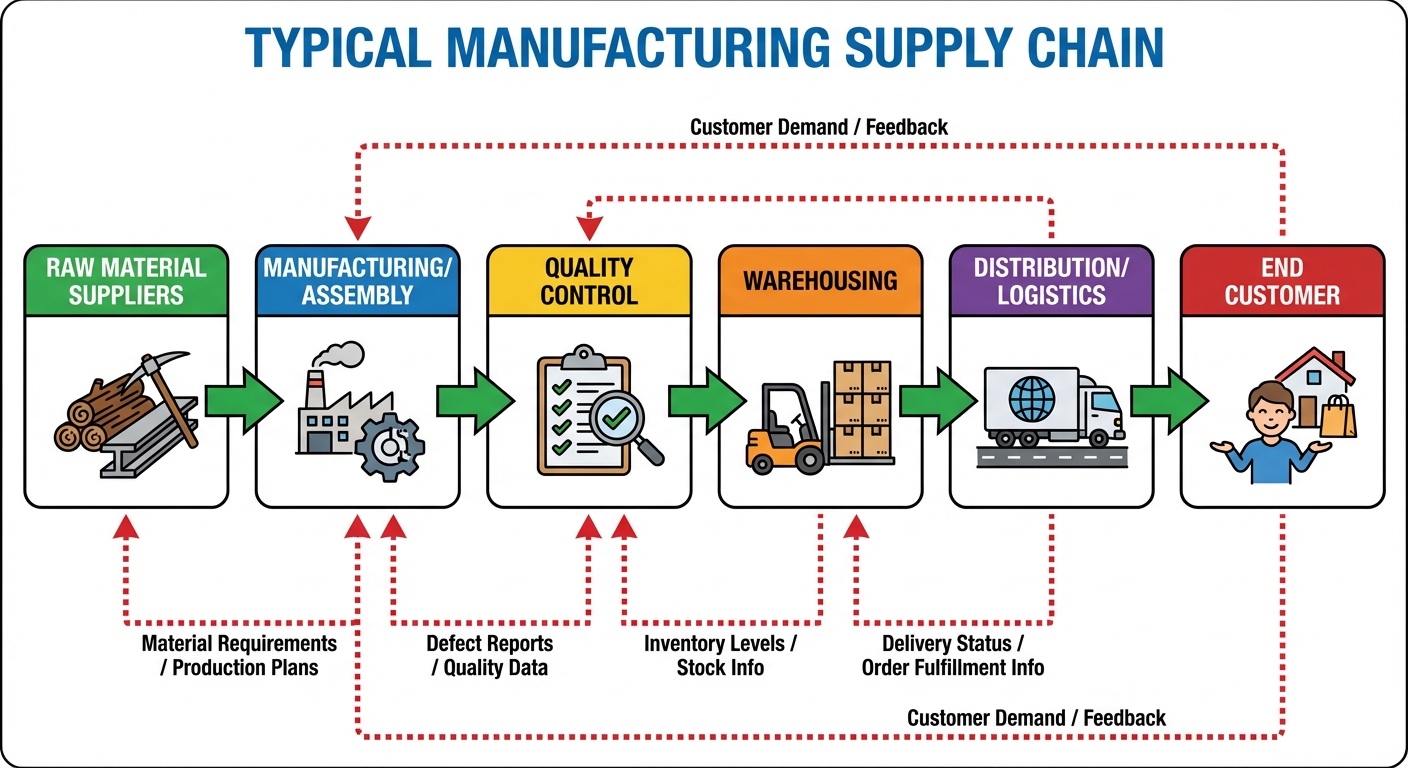
C. Supply Chain Management
- Suppliers: List of key vendors, backup suppliers, and credit terms.
- Inventory Management: Strategy to minimize holding costs (e.g., Just-In-Time inventory) while preventing stockouts.
D. Technology and Equipment
- Hardware: Machinery, computers, vehicles.
- Software: CRM (Customer Relationship Management), ERP (Enterprise Resource Planning), POS (Point of Sale).
4. The Financial Plan
The Financial Plan translates all previous plans into numerical data. It determines the economic feasibility of the business and is critical for securing funding.
A. Key Assumptions
A section detailing the logic behind the numbers (e.g., "We assume a 5% month-over-month growth based on industry standards").
B. Start-up Costs
- CAPEX (Capital Expenditure): One-time costs for equipment, renovation, and licenses.
- OPEX (Operating Expenditure): Ongoing costs like rent, utilities, and salaries required before the business generates revenue (working capital).
C. Three Key Financial Statements
- Income Statement (Profit & Loss): Shows Revenue - Expenses = Net Profit/Loss over a period of time.
- Cash Flow Statement: Tracks the actual movement of cash in and out. Crucial for survival, as a profitable business can still fail if it runs out of cash.
- Balance Sheet: A snapshot of the business's financial health at a specific moment (Assets = Liabilities + Equity).
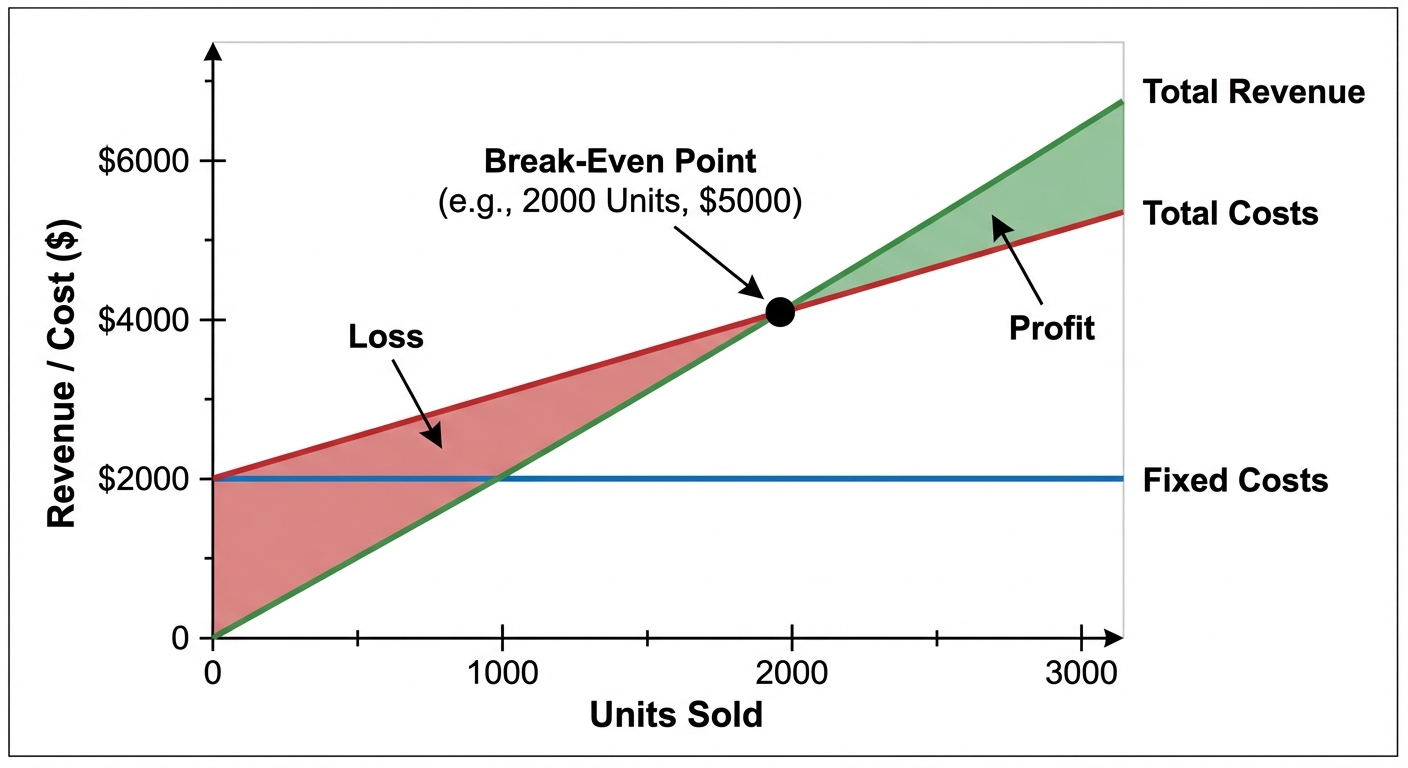
D. Break-Even Analysis
This calculation determines the sales volume required to cover total costs. Below this point, the business loses money; above it, the business profits.
E. Funding Requirements
- Amount Needed: Total capital required to launch and sustain operations until profitability.
- Use of Funds: Pie chart or list showing how the money will be spent (e.g., 40% Product Dev, 30% Marketing, 30% Operations).
- Exit Strategy: How investors will eventually get their money back (IPO, Acquisition, Buyback).