Practical 5
Practical 5: Application of GIS in Hydrological Mapping
1. Aim/Objective
- To extract and perform Morphometric Analysis of a drainage basin using a Digital Elevation Model (DEM).
- To map and analyze flood-affected areas using GIS and remote sensing techniques, focusing on a case study of the Ghaggar River in Punjab.
2. Apparatus / Software Required
- Hardware: High-performance PC/Laptop (Minimum 8GB RAM, Multi-core processor).
- Software: QGIS (v3.x) with SAGA/GRASS toolboxes OR ArcGIS Pro / ArcMap (v10.x) with Spatial Analyst Extension.
- Datasets Required:
- Digital Elevation Model (DEM): SRTM (Shuttle Radar Topography Mission) 30m resolution or ASTER GDEM.
- Satellite Imagery: Sentinel-1 (SAR) Ground Range Detected (GRD) data for pre-flood and post-flood dates, or Landsat 8 / Sentinel-2 optical imagery.
- Vector Data: Administrative boundary shapefile of Punjab, Ghaggar river basin shapefile, and Land Use/Land Cover (LULC) shapefiles.
3. Theory
Geographical Information Systems (GIS) play a crucial role in hydrological mapping and disaster management.
Morphometric Analysis is the mathematical measurement and analysis of the configuration of the earth's surface and the shape/dimensions of its landforms. It includes linear aspects (stream order, stream length, bifurcation ratio), areal aspects (drainage density, stream frequency), and relief aspects. Understanding these parameters helps in predicting the hydrological behavior of a catchment, such as runoff and flood potential.
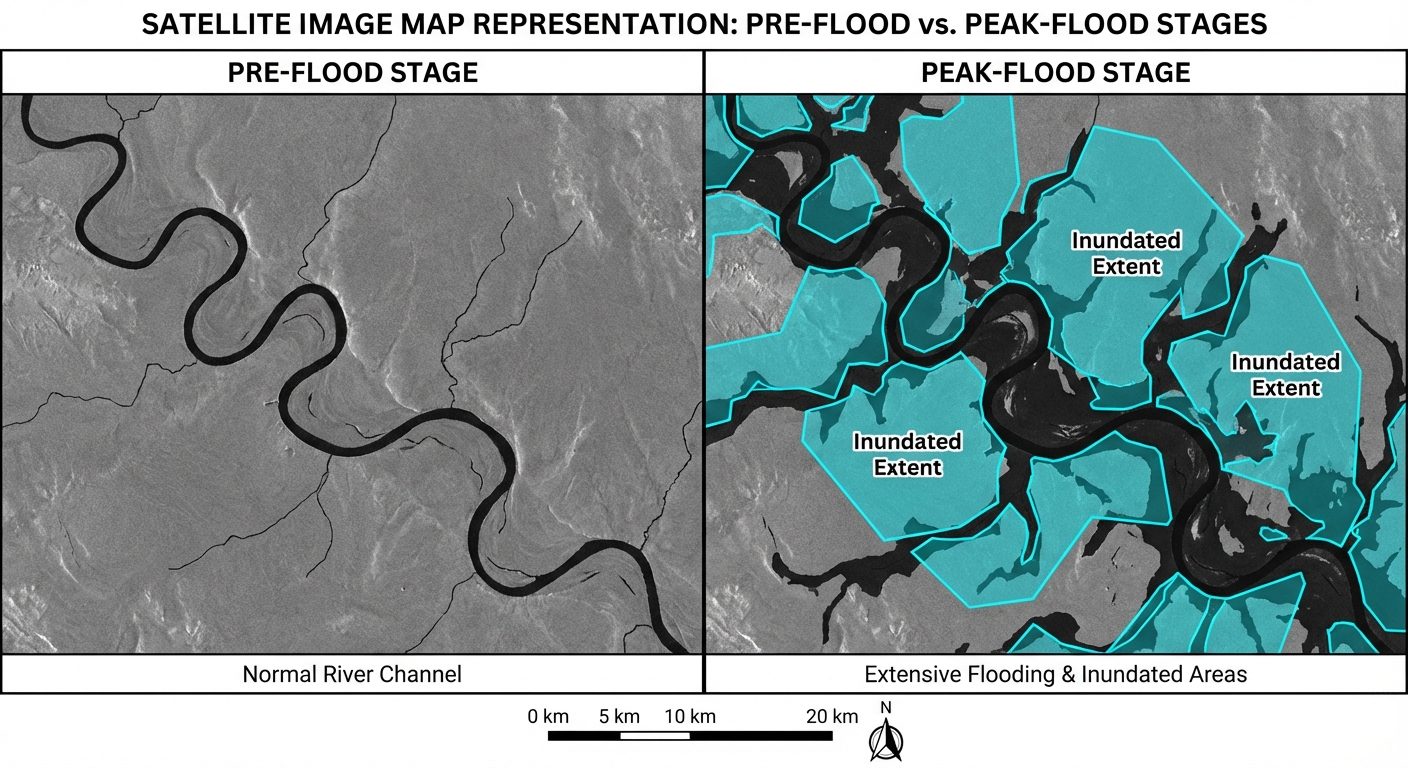
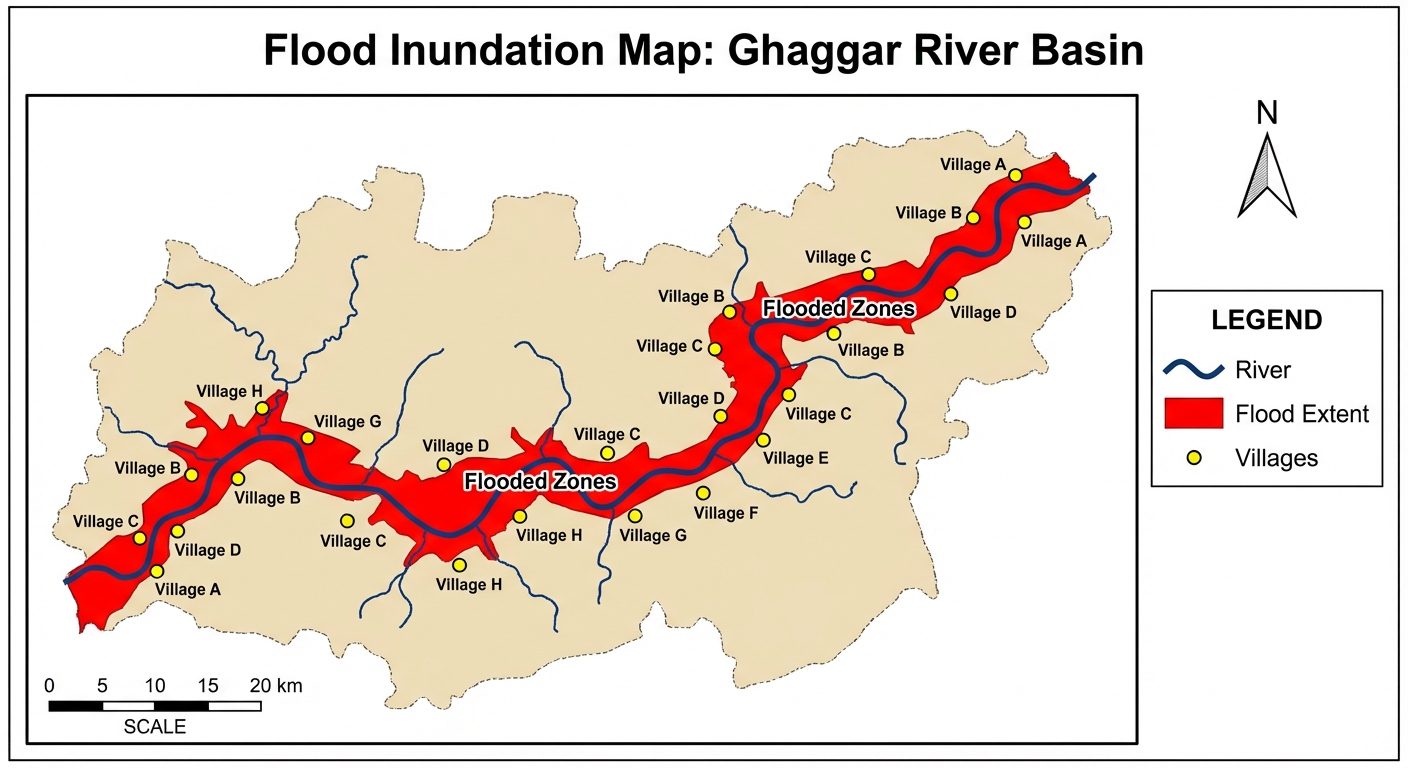
Flood Inundation Mapping involves identifying areas submerged under water during peak flooding. The Ghaggar River is a seasonal river flowing through Punjab and Haryana, notorious for causing severe flooding during the monsoon season due to its flat terrain and poor drainage capacity. By comparing pre-flood and peak-flood satellite imagery (especially Synthetic Aperture Radar/SAR data, which can penetrate clouds during monsoons), GIS enables the extraction of flooded pixels. Overlaying this on LULC maps determines the exact agricultural or residential areas impacted.
4. Setup / Workflow Diagrams
5. Procedure
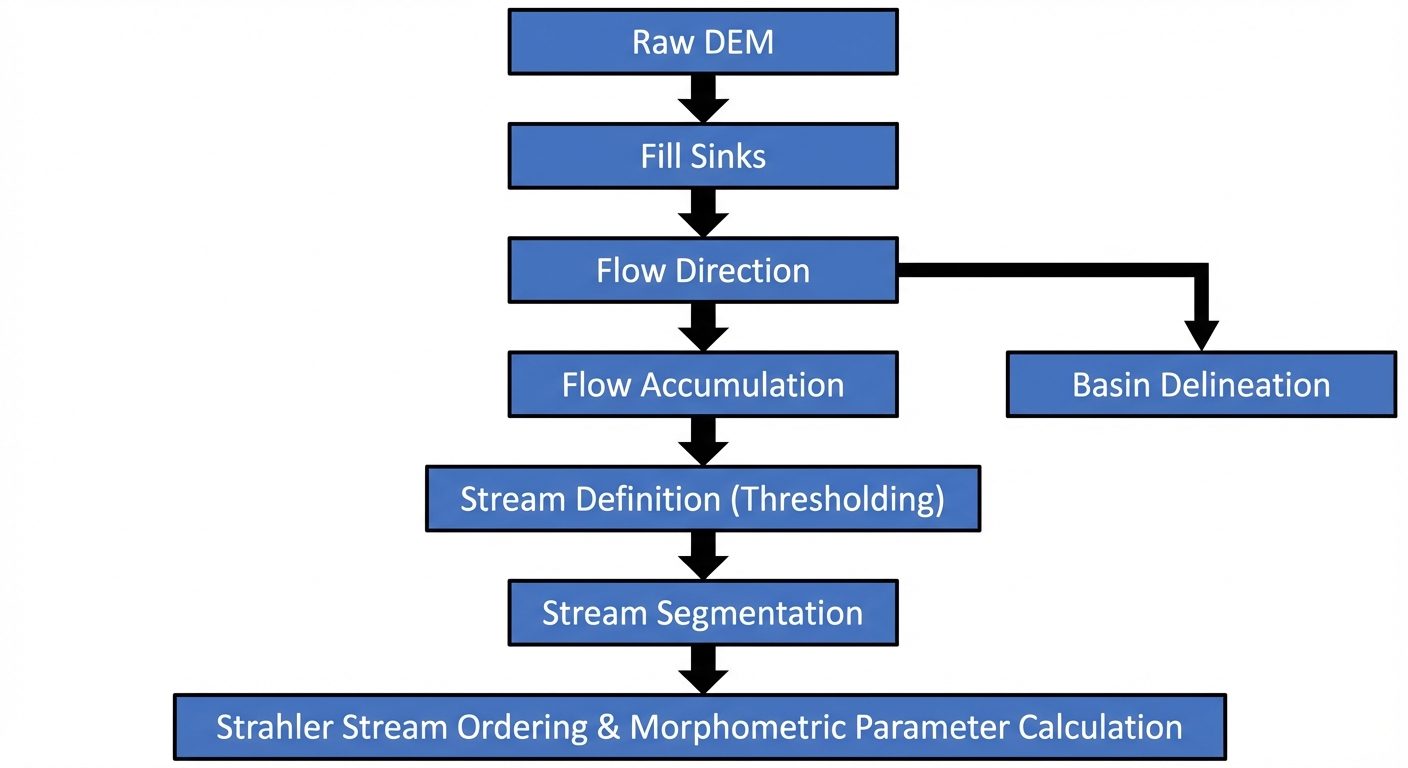
Part A: Morphometric Analysis of a Watershed
- Data Import: Launch your GIS software (QGIS/ArcGIS). Add the SRTM DEM of the study area.
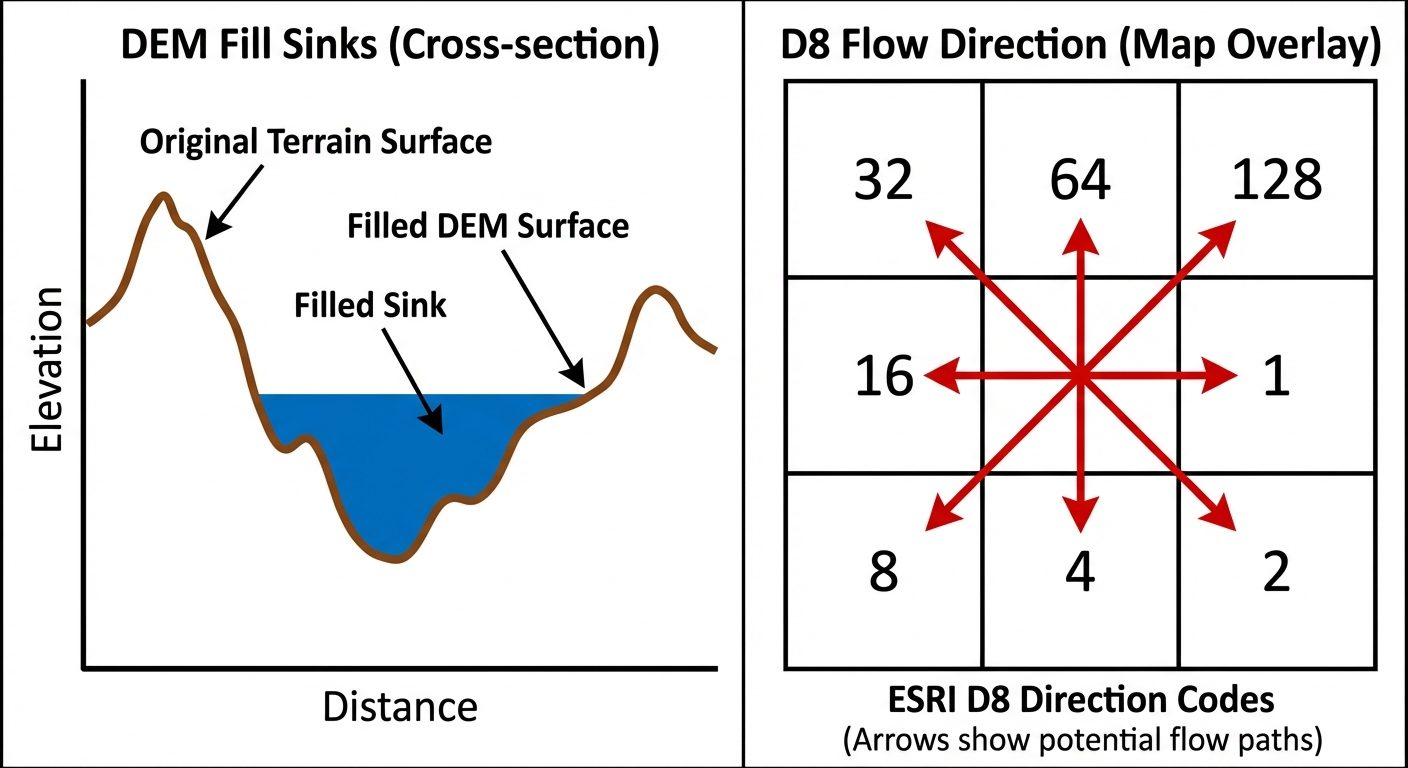
- Fill Sinks: Navigate to
Spatial Analyst Tools > Hydrology > Fill. Run this tool to remove small imperfections (sinks) in the data to ensure proper flow routing. - Flow Direction: Use the
Flow Directiontool on the "Filled DEM" to create a raster showing the direction of flow out of each cell (using the D8 algorithm). - Flow Accumulation: Run the
Flow Accumulationtool using the "Flow Direction" raster to calculate accumulated flow as the accumulated weight of all cells flowing into each downslope cell. - Stream Definition: Use the
Raster Calculatorto apply a threshold to the Flow Accumulation raster (e.g.,FlowAccumulation > 1000). This generates a binary raster where streams exist. - Stream Ordering: Use the
Stream Ordertool (Strahler method). Input the stream raster and the Flow Direction raster to assign a numeric order to river branches. - Stream to Feature: Convert the raster streams into vector polylines using the
Stream to Featuretool. Open the Attribute Table to view the length and order of each stream segment.
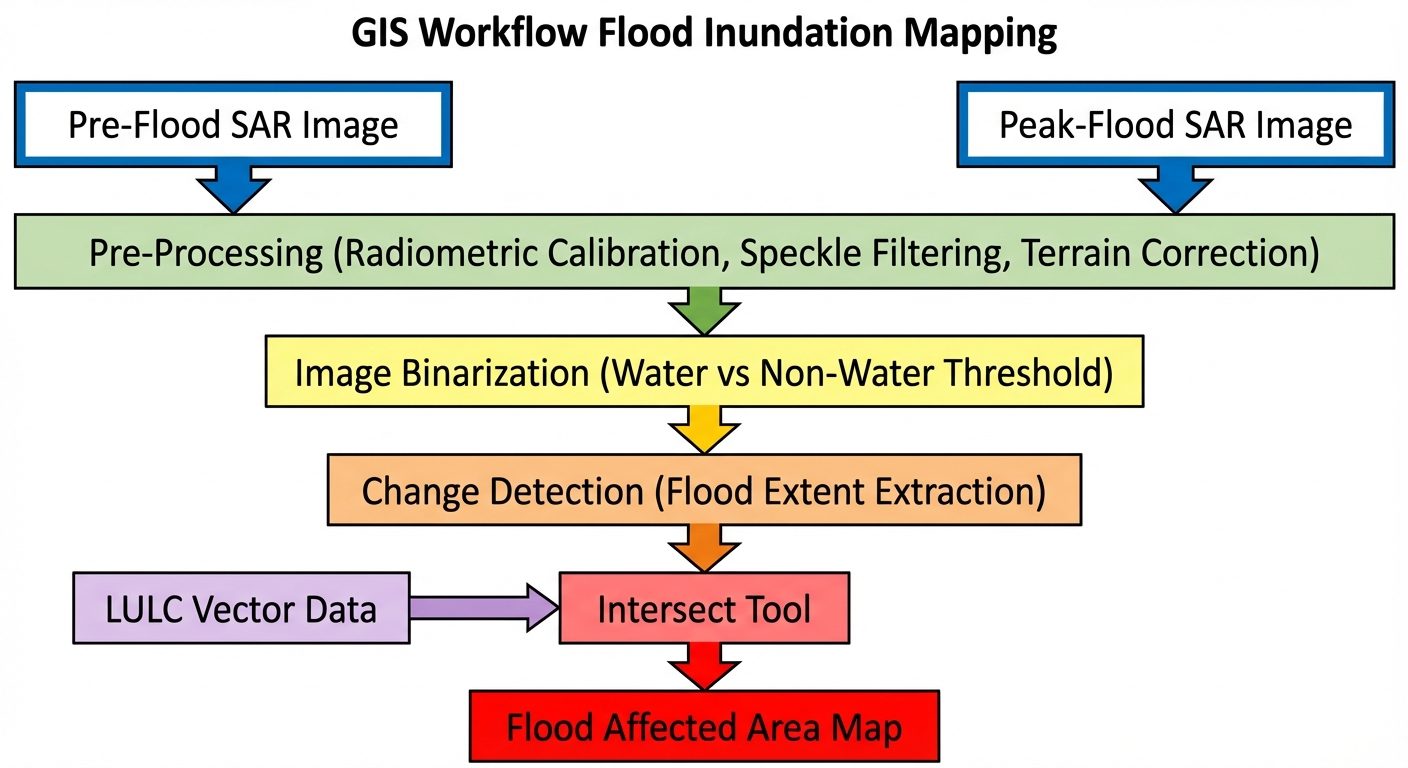
Part B: Application of GIS in Flood Affected Areas (Ghaggar River Case Study)
- Data Loading: Load the Pre-flood and Peak-flood Sentinel-1 SAR rasters of the Ghaggar River basin in Punjab. Add the Punjab district/village boundary shapefiles.
- SAR Pre-processing: If using raw SAR data, apply Radiometric Calibration to convert digital numbers to backscatter coefficients (Sigma Naught). Apply a Lee or Refined Lee Speckle Filter to reduce radar noise.
- Thresholding (Water Classification): Water absorbs radar signals, appearing very dark (low backscatter). Use the
Raster Calculatorto apply a threshold (e.g.,Sigma0 < -16 dB) to classify pixels into Water (1) and Non-Water (0) for both pre- and peak-flood images. - Change Detection: Subtract the pre-flood water raster from the peak-flood water raster using
Raster Calculator. The resulting pixels with a value of '1' represent newly flooded areas (Inundation Extent). - Vectorization: Convert the flooded area raster to a vector polygon shapefile.
- Overlay Analysis: Use the
Intersecttool. Input the flooded area polygon and the Land Use/Land Cover (LULC) polygon. Calculate the geometry to find the exact area (in sq km) of agricultural land, settlements, and roads submerged by the Ghaggar river flood. - Map Composition: Create a final layout showing the Ghaggar river, flooded extents (highlighted in red/cyan), and affected settlements, including a legend, scale bar, and north arrow.
6. Observations / Attribute Tables
| Table 1: Morphometric Parameters (Stream Order & Length) | Stream Order (u) | Number of Streams () | Total Stream Length () in km | Mean Stream Length () in km |
|---|---|---|---|---|
| I | 145 | 310.5 | 2.14 | |
| II | 36 | 155.2 | 4.31 | |
| III | 9 | 80.4 | 8.93 | |
| IV | 2 | 42.1 | 21.05 | |
| V | 1 | 25.0 | 25.00 |
| Table 2: Ghaggar River Flood Impact Analysis (Overlay Output) | LULC Class Affected | Total Area in Basin () | Flooded Area () | Percentage Affected (%) |
|---|---|---|---|---|
| Agricultural Land | 1250.0 | 345.5 | 27.6% | |
| Built-up / Settlements | 180.0 | 12.4 | 6.8% | |
| Barren Land | 210.0 | 45.2 | 21.5% | |
| Total | 1640.0 | 403.1 | 24.5% |
7. Calculations
1. Bifurcation Ratio ()
The ratio of the number of streams of a given order to the number of streams of the next higher order.
Formula:
Calculation for Order I to II:
(Note: An between 3.0 and 5.0 indicates a basin in which geologic structures do not distort the drainage pattern).
2. Drainage Density ()
Total length of all streams divided by the total area of the basin.
Assume Total Area (A) =
Total Stream Length (L) =
Formula:
Calculation:
8. Result
- The morphometric analysis was successfully completed. The watershed exhibits a dendritic drainage pattern with a stream network extending up to the 5th order. The mean bifurcation ratio is approximately 4.0, indicating standard geological control.
- The flood inundation map of the Ghaggar River was successfully generated using pre- and post-flood SAR imagery. The overlay analysis reveals that approximately of agricultural land was submerged during the peak flood event, highlighting the river's impact on local livelihoods in Punjab.
9. Viva Questions
Q1. What is a Digital Elevation Model (DEM)?
Ans: A DEM is a 3D computer graphics representation of elevation data to represent terrain, commonly used in GIS to extract hydrological features like slope, flow direction, and basins.
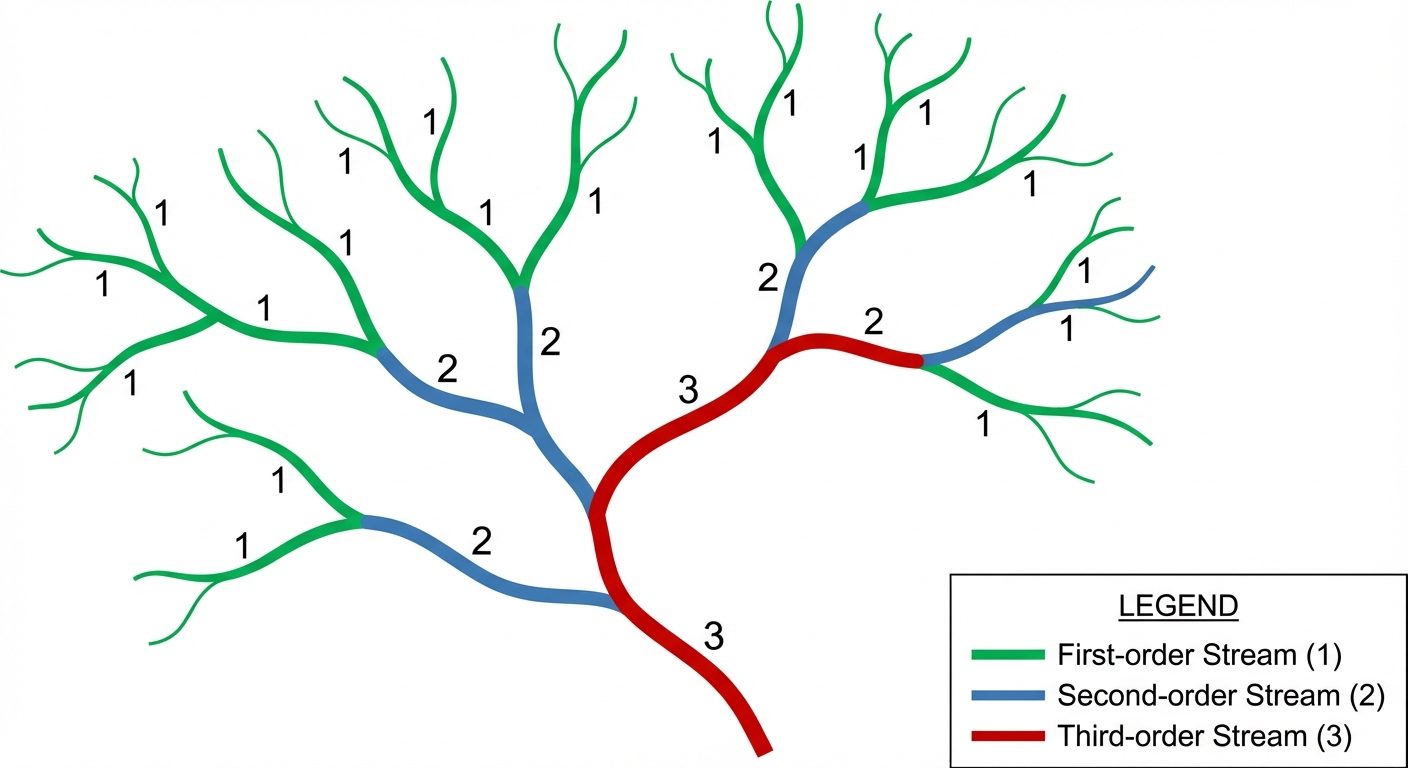
Q2. Explain the Strahler method of Stream Ordering.
Ans: In the Strahler method, all outermost links are order 1. When two streams of the same order () merge, the resulting stream is order . When two streams of different orders merge, the resulting stream retains the higher of the two orders.
Q3. Why is SAR imagery (like Sentinel-1) preferred over optical imagery (like Landsat) for flood mapping?
Ans: SAR is an active remote sensing technology using microwaves that can penetrate clouds and rain, which are consistently present during monsoon flooding. Optical sensors cannot see through clouds.
Q4. What is the significance of the "Fill Sinks" process before hydrological modeling?
Ans: Sinks are artificial depressions in the DEM caused by data errors. If not filled, the GIS flow routing algorithm will stop at these sinks, incorrectly trapping water instead of allowing continuous flow to the basin outlet.
Q5. How does water appear on a SAR image and why?
Ans: Water bodies appear very dark (low pixel values) on a SAR image because the smooth surface of the water acts like a mirror, reflecting the radar pulses away from the satellite sensor (specular reflection), resulting in low backscatter.
Q6. What does a high Drainage Density indicate?
Ans: A high drainage density indicates an area with highly impermeable subsoil material, sparse vegetation, and mountainous relief, which typically results in rapid surface runoff and higher flood risk.