Practical 6
Practical 6: Application of GIS for Relief Mapping
1. Aim/Objective
To understand and apply Geographic Information System (GIS) techniques for relief mapping by processing elevation data to create a Digital Elevation Model (DEM), a Slope Map, and a Contour Map.
2. Apparatus/Components Required
Since this is a software-based GIS spatial analysis practical, the physical hardware and software specifications replace traditional electronic components:
- Hardware: Computer System/Workstation (Minimum specifications: Intel Core i3/i5 or equivalent, 8GB RAM, 50GB free HDD/SSD storage, Dedicated or Integrated Graphics).
- Software: Open-source GIS software (QGIS v3.22 or higher) or Proprietary GIS (ArcGIS Pro / ArcMap 10.x).
- Data Sources:
- Elevation Point Data (Vector Point Shapefile
.shpcontaining Z-values/elevation). - Alternatively, raw SRTM (Shuttle Radar Topography Mission) 30m DEM
.tiffile. - Study Area Boundary (Polygon Shapefile
.shp).
- Elevation Point Data (Vector Point Shapefile
3. Theory
Relief Mapping: Relief refers to the quantitative measurement of vertical elevation change in a landscape. It is the difference between maximum and minimum elevations within a given area. In GIS, relief mapping represents the 3D topography of the Earth's surface on a 2D digital screen or map.
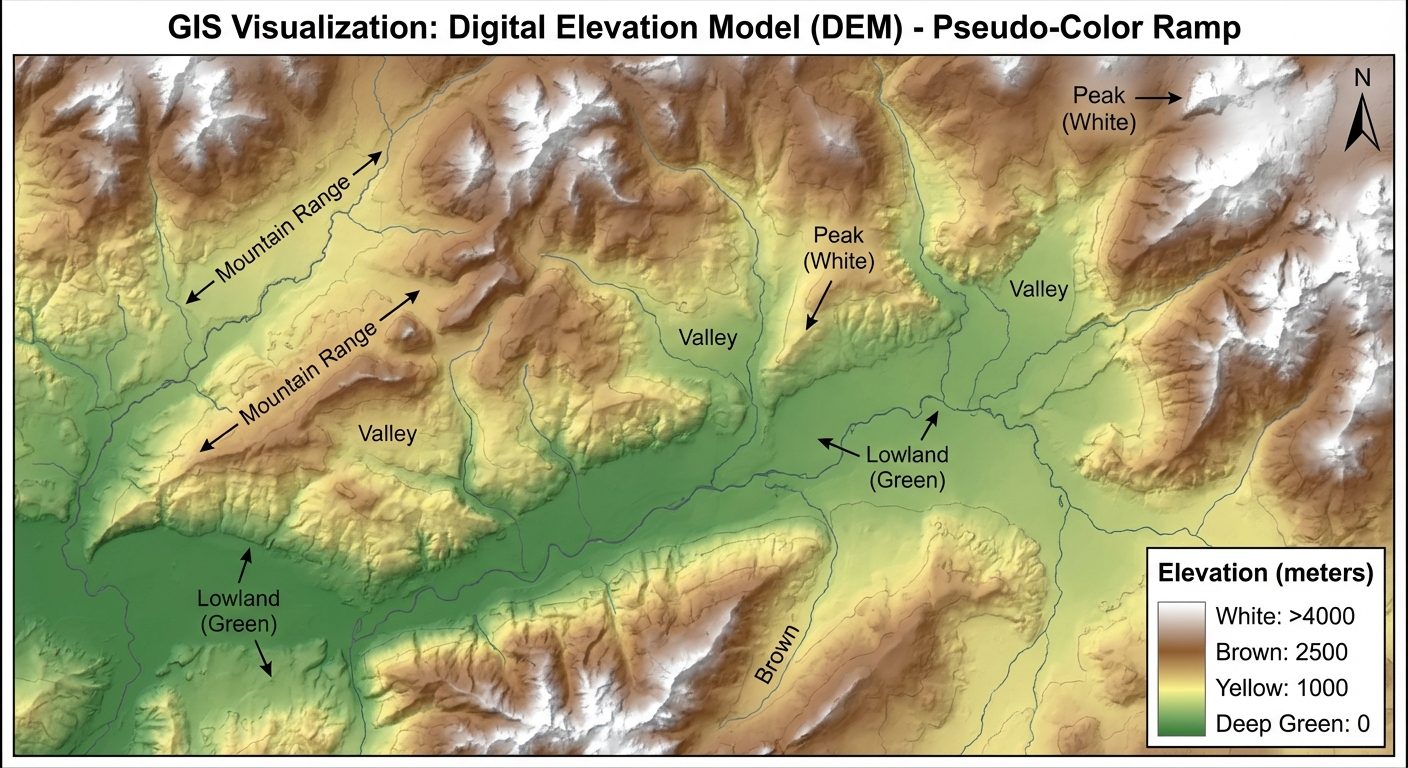
- Digital Elevation Model (DEM): A continuous raster grid where each pixel (cell) contains an elevation value representing the bare earth's surface, devoid of vegetation and man-made structures.
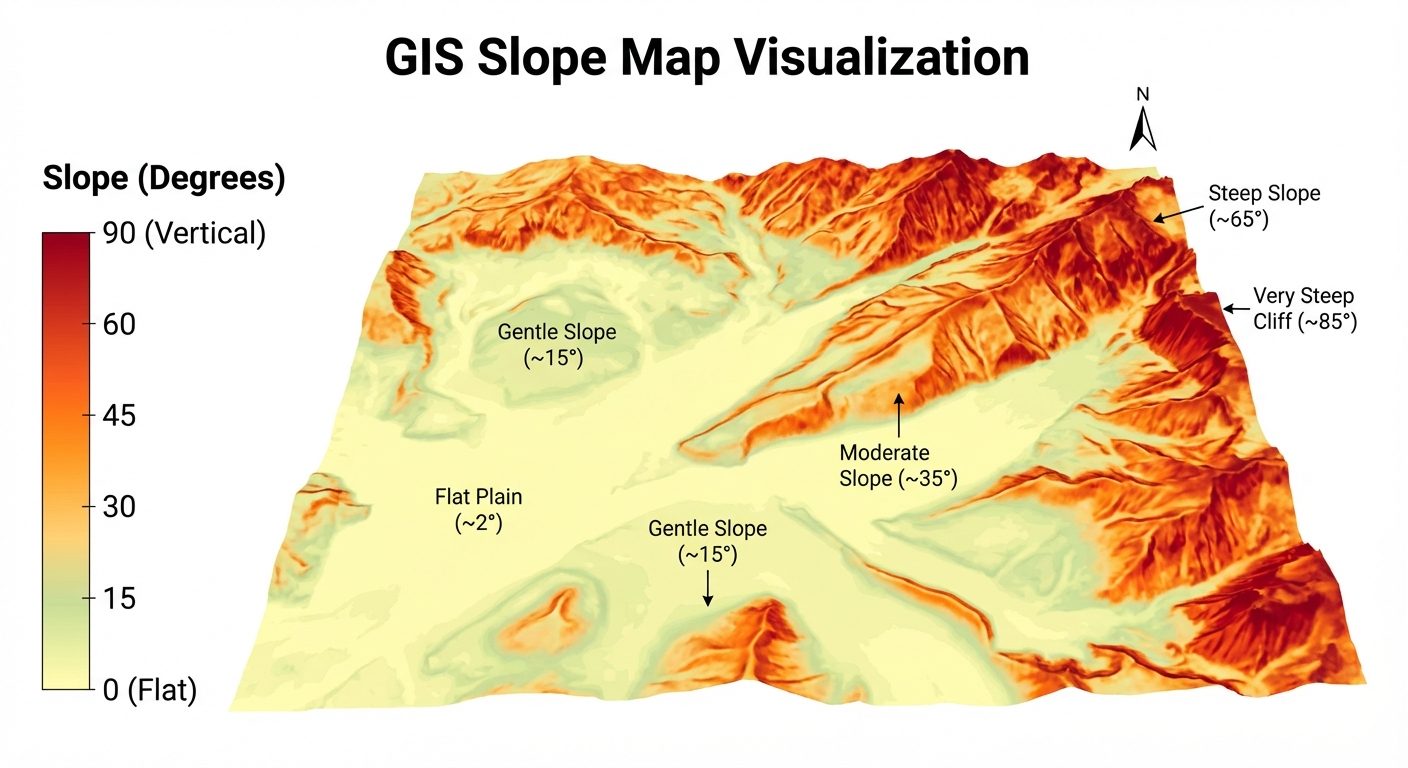
- Slope Map: Slope represents the rate of change of elevation for each raster cell. It is the first derivative of a DEM. It calculates the maximum rate of change in value from that cell to its neighbors. Slope can be expressed in Degrees (0° to 90°) or Percentage (0% to theoretically approaching infinity).
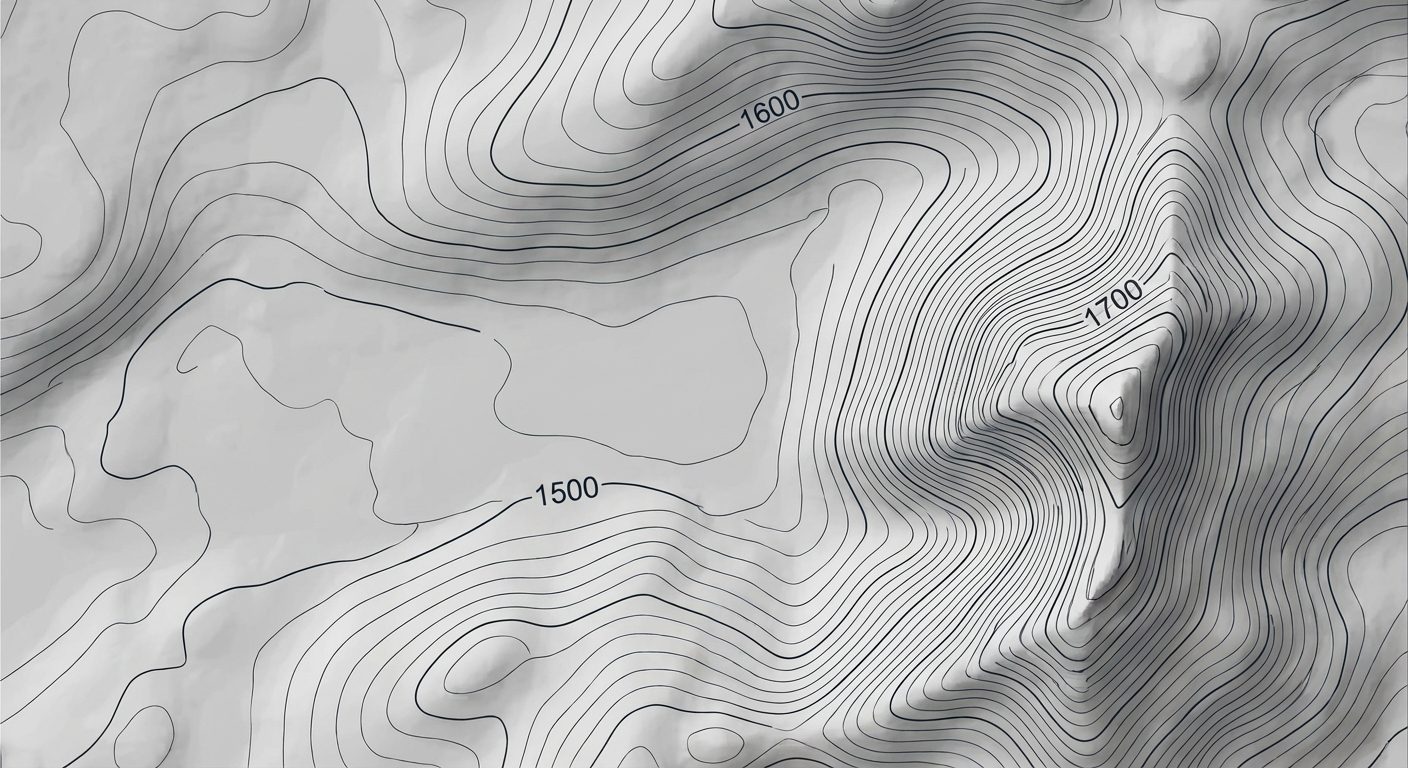
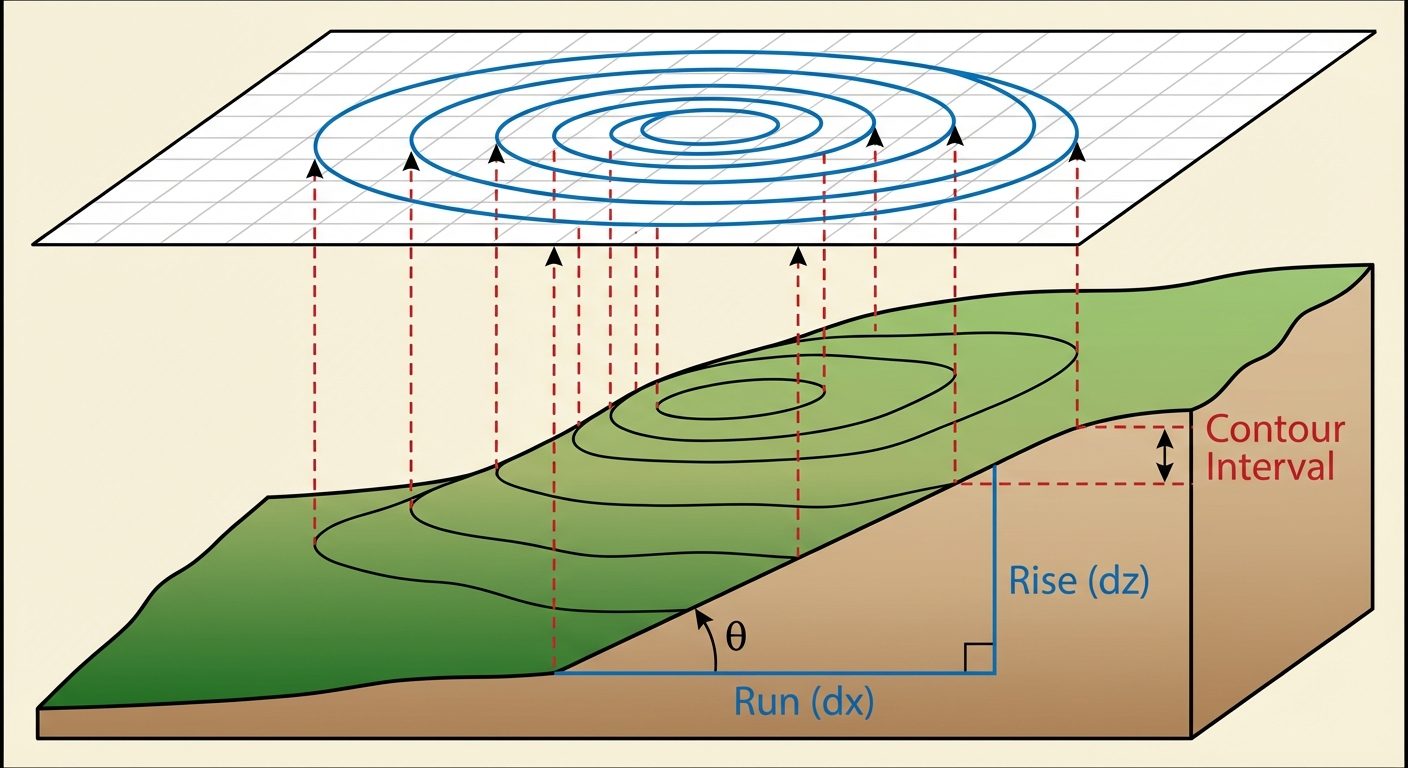
- Contour Map: Contours (or isolines) are vector lines that connect contiguous points of equal elevation. The distance between two adjacent contour lines is called the contour interval. Closely spaced contours indicate steep terrain, while widely spaced contours indicate flat terrain.
4. System Setup and Workflow Diagram
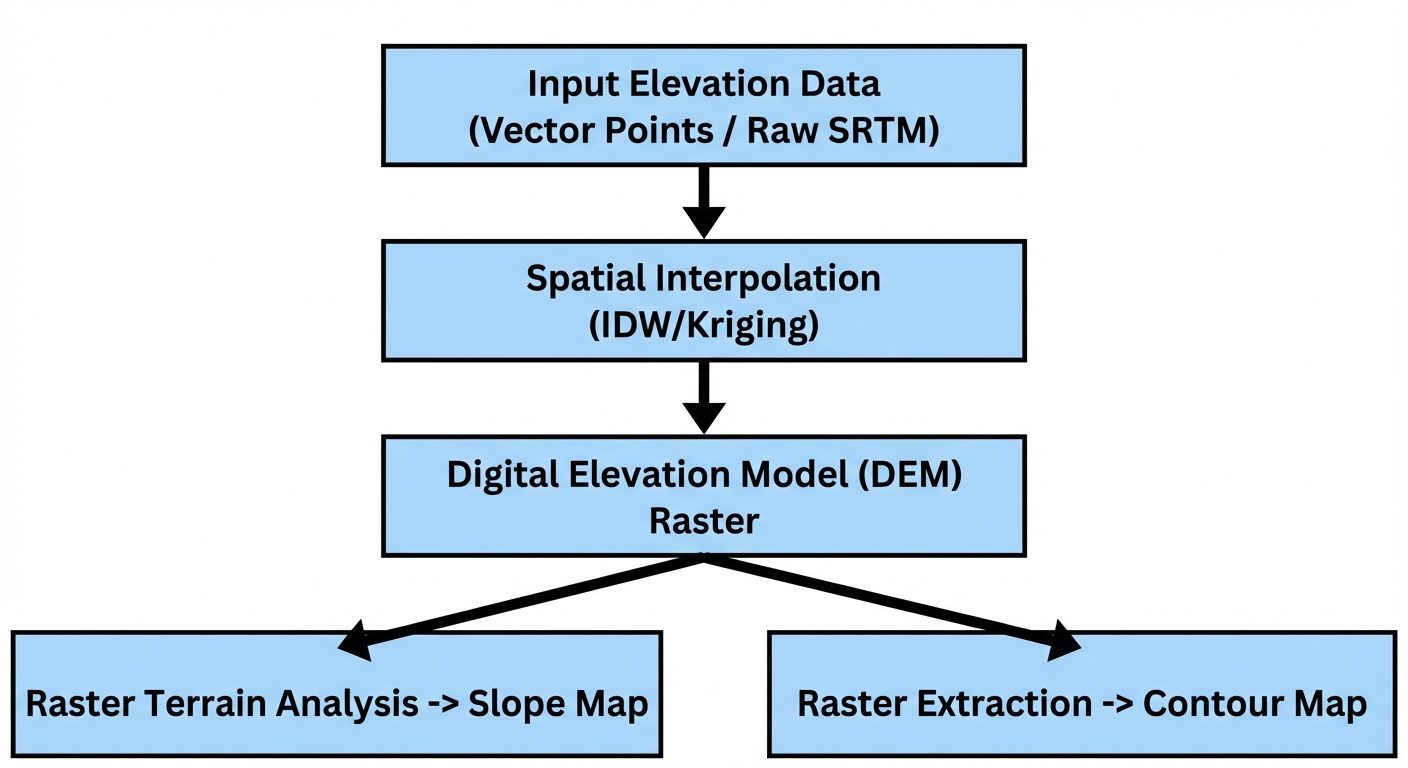
For this experiment, a standard GIS software environment is used. The workspace must be set to a Projected Coordinate System (e.g., UTM) rather than a Geographic Coordinate System (Lat/Long) to ensure accurate calculation of slope and distances in meters.
5. Procedure
Task 1: Creation of Digital Elevation Model (DEM)
Note: If starting with raw SRTM raster data, simply clip the raster to the study area. Below is the procedure for creating a DEM from point elevation data.
- Launch the GIS software and start a new project.
- Go to Layer > Add Layer > Add Vector Layer and browse for the Elevation Point Shapefile.
- Verify the Coordinate Reference System (CRS) is set to a projected system (e.g., WGS 84 / UTM Zone).
- Navigate to the Processing Toolbox and search for Interpolation (e.g., IDW - Inverse Distance Weighting).
- In the Interpolation dialog:
- Select the input point layer.
- Set the Interpolation attribute to the field containing the elevation (Z) values.
- Set the output Pixel size (e.g., 30 meters).
- Specify the output extent to match your study area.
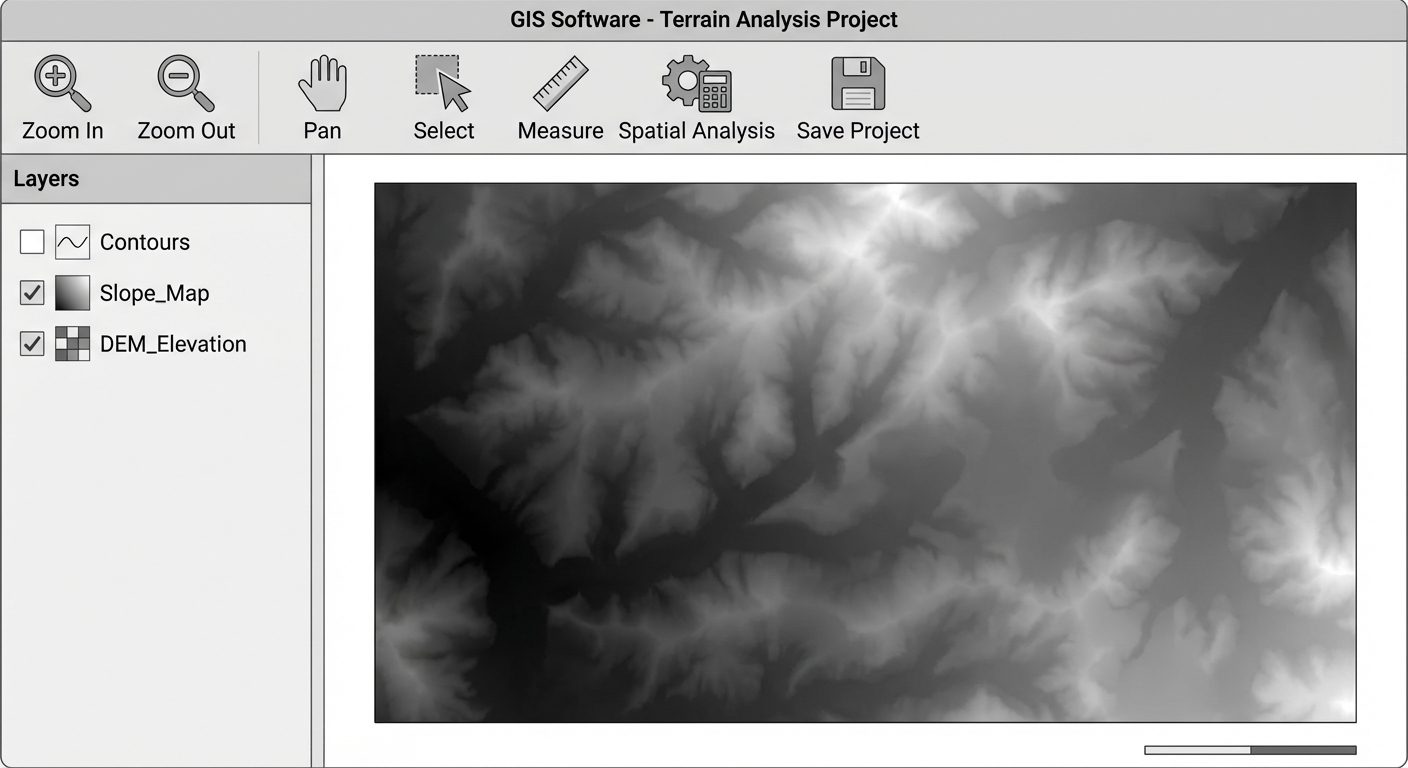
- Click Run. A continuous grayscale DEM raster will be generated.
- Right-click the newly created DEM layer -> Properties -> Symbology. Change the render type to "Singleband pseudocolor" and choose an elevation color ramp (e.g., green for lowlands, brown/white for highlands) to enhance relief visualization.
Task 2: Creation of Slope Map
- Select the newly created DEM layer in the layers panel.
- Navigate to Raster > Analysis > Slope (or use the Spatial Analyst extension in ArcGIS).
- In the Slope dialog box:
- Input layer: Your DEM raster.
- Select the output measurement: choose Degrees (default) or Percent valid.
- Set Z-factor to 1.0 (assuming horizontal and vertical units are both in meters).
- Provide an output file name (e.g.,
slope_map.tif).
- Click Run.
- Adjust the symbology of the Slope layer using a sequential color ramp (e.g., light yellow for flat areas (0-5 degrees) to dark red for steep slopes (>45 degrees)).
Task 3: Creation of Contour Map
- Navigate to Raster > Extraction > Contour.
- In the Contour dialog box:
- Input layer: Your DEM raster.
- Interval between contour lines: Set based on the relief (e.g., 10 meters, 50 meters, or 100 meters depending on terrain steepness).
- Attribute name: "ELEV" (this creates a field in the output vector file storing the specific elevation of that line).
- Provide an output file name (e.g.,
contours.shp).
- Click Run.
- The software will generate a vector line layer over the DEM.
- Right-click the Contour layer -> Properties -> Labels. Enable single labels and set the label value to the "ELEV" field so that the elevation value is drawn directly onto the contour lines.
6. Observations / Layer Properties Tables
Record the metadata and statistical properties of the generated GIS layers.
| Table 1: Input Data / DEM Properties | Parameter | Value / Observation |
|---|---|---|
| Coordinate Reference System | WGS 84 / UTM (Local Zone) | |
| Raster Resolution (Pixel Size) | 30m x 30m | |
| Minimum Elevation (Z_min) | [Record from Software] e.g., 210 m | |
| Maximum Elevation (Z_max) | [Record from Software] e.g., 1850 m | |
| Relief Difference | Z_max - Z_min = 1640 m |
| Table 2: Slope & Contour Output Properties | Output Map | Classification / Interval | Display Strategy (Symbology) |
|---|---|---|---|
| Slope Map | 0° - 15° (Gentle) | Light Green / Yellow | |
| Slope Map | 15° - 45° (Moderate) | Orange | |
| Slope Map | > 45° (Steep) | Dark Red | |
| Contour Map | Contour Interval (CI) | e.g., 50 meters | |
| Contour Map | Index Contours | Highlighted every 250 meters |
7. Calculations
Although GIS software automates the spatial mathematics, it is important to understand the underlying calculations performed by the system:
1. Slope Calculation (for a single pixel):
Slope is calculated using the rate of change of the surface in the horizontal () and vertical () directions from the center cell to its 8 neighboring cells.
2. Determining Appropriate Contour Interval (CI):
To avoid an overcrowded or sparse map, a general empirical rule for contour intervals based on map scale and total relief is used:
If Relief = .
To get approximately 30-40 contour lines across the map:
8. Result
The application of GIS for relief mapping was successfully demonstrated.
- A continuous Digital Elevation Model (DEM) was generated, accurately representing the terrain's topographical variance.
- A Slope Map was successfully extracted from the DEM, highlighting flat plains and steep gradients in degrees.
- A Contour Map with a calculated contour interval was generated, with elevation values correctly labeled on the isolines, allowing for standard topographic map reading.
9. Viva Questions
Q1. What is a Digital Elevation Model (DEM)?
Ans: A DEM is a raster-based digital dataset representing the 3D bare-earth surface elevations of a terrain, excluding trees, buildings, and other surface objects.
Q2. What is the difference between a DEM, DSM, and DTM?
Ans: A DEM generally refers to bare earth. A DSM (Digital Surface Model) includes all natural and built features (like tree canopies and building roofs). A DTM (Digital Terrain Model) is a DEM augmented with breaklines and distinct terrain features like ridges and rivers.
Q3. How does GIS calculate the slope of a terrain?
Ans: GIS calculates slope by looking at a specific raster cell and its 8 neighboring cells. It calculates the maximum rate of change in elevation (rise) over the distance (run) between the cells, outputting the result in degrees or percentage.
Q4. What does a Contour Interval represent?
Ans: It represents the vertical distance or difference in elevation between two adjacent contour lines on a topographic map.
Q5. If contour lines are very close to each other on a map, what does it indicate about the terrain?
Ans: Closely spaced contour lines indicate a steep slope or cliff. Widely spaced contour lines indicate a gentle slope or relatively flat terrain.
Q6. What is Z-factor in slope analysis and when do you need to change it?
Ans: The Z-factor is a scaling factor used to convert vertical elevation units to horizontal coordinate units. If your map's horizontal units are in meters and elevation is in feet, you must apply a Z-factor (approx 0.3048) to standardize the units before calculating slope. If both are in meters, the Z-factor is 1.
Q7. Name two common spatial interpolation techniques used to create a DEM from point data.
Ans: Inverse Distance Weighting (IDW) and Kriging.