Practical 1
Practical 1: Designing of GIS Data Structure for Large Scale Mapping (Spatial Data and Non-Spatial Datasets)
1. Aim/Objective
To design and create a Geographic Information System (GIS) data structure for large-scale mapping by developing spatial datasets (Point, Line, and Area/Polygon symbols) and associating them with appropriate non-spatial (attribute) datasets using GIS software.
2. Apparatus/Components Required
- Hardware: Personal Computer/Workstation (Minimum 8GB RAM, Multi-core processor), standard mouse with a scroll wheel (essential for precise digitization and panning).
- Software: QGIS (Quantum GIS - Open Source) v3.x or ESRI ArcGIS Pro.
- Data Inputs: High-resolution Georeferenced Satellite Imagery or scanned Topographical Map (Large Scale, e.g., 1:5,000 or 1:10,000) to serve as a base map.
3. Theory
A Geographic Information System (GIS) integrates spatial and non-spatial data to enable geographic analysis.
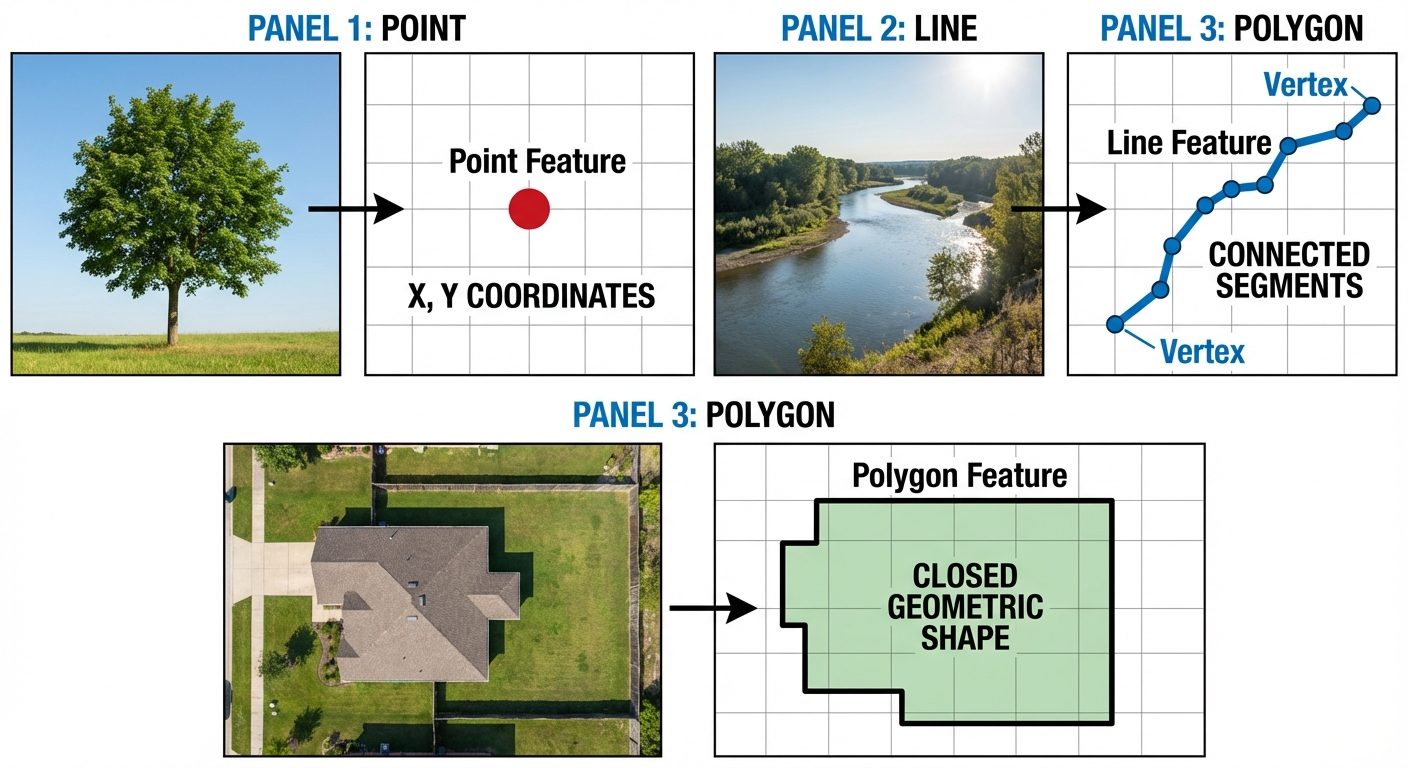
- Spatial Data: Represents the absolute and relative location of geographic features. In a Vector Data Model, spatial data is represented using geometry primitives:
- Point (0-Dimensional): Used for discrete features whose area is not relevant at the map's scale (e.g., light poles, individual trees, wells).
- Line (1-Dimensional): Used for linear features possessing length but no significant width at the map's scale (e.g., roads, railway tracks, streams).
- Area/Polygon (2-Dimensional): Used for enclosed features having both length and width (e.g., building footprints, lakes, forest boundaries).
- Non-Spatial Data (Attribute Data): Tabular data detailing the characteristics of the spatial features. For a road (line spatial data), attributes might include name, surface type (asphalt/dirt), and number of lanes.
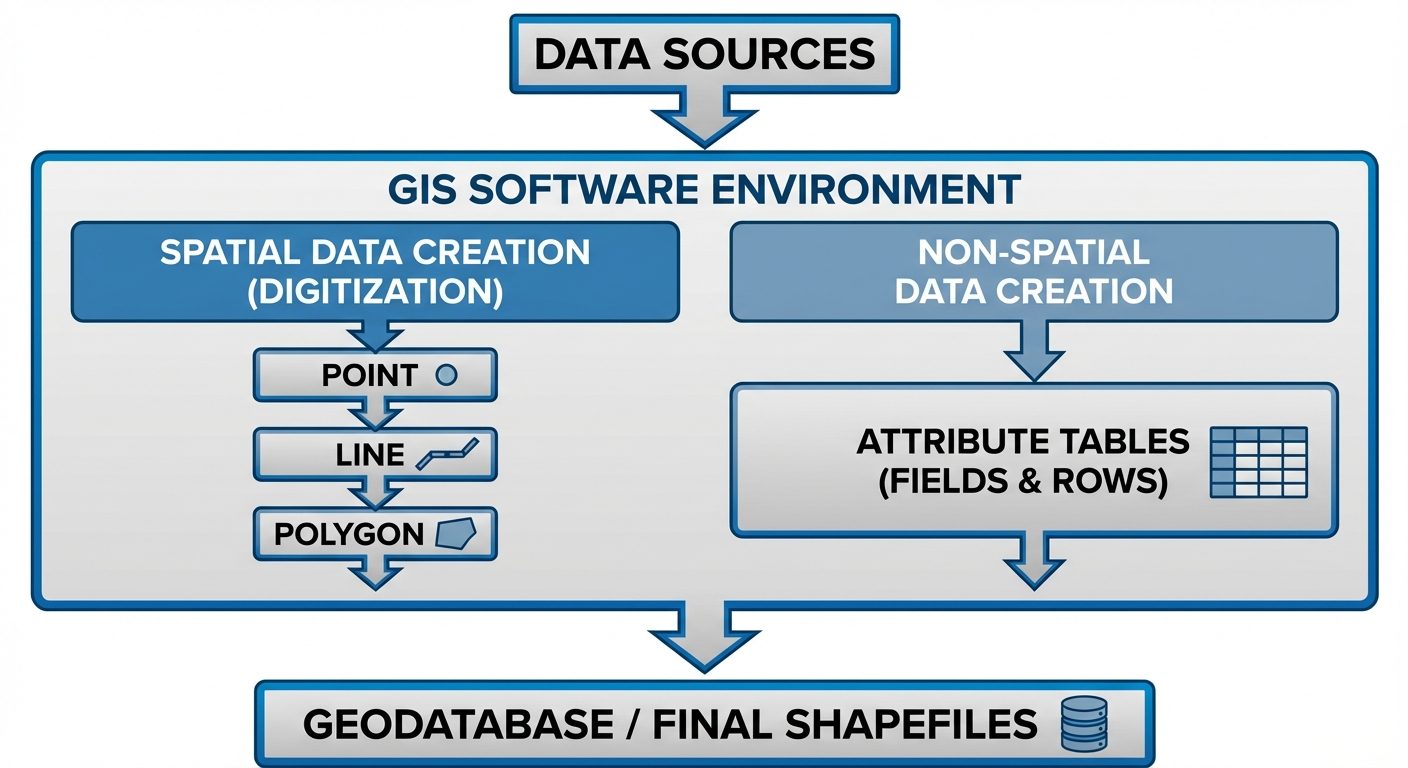
4. Circuit Diagram / Setup (GIS Workflow Architecture)
In a software-based GIS practical, the "setup" refers to the system architecture and the software interface environment.
5. Procedure
Step 5.1: Software Initialization and Base Map Loading
- Launch the GIS software (e.g., QGIS).
- Start a New Project and set the appropriate Coordinate Reference System (CRS), preferably a projected coordinate system suitable for large-scale mapping (e.g., WGS 84 / UTM Zone corresponding to your region).
- Load the georeferenced base map (Raster image/Satellite imagery) via
Layer > Add Layer > Add Raster Layer.
Step 5.2: Designing the Spatial Data Structure (Creating Shapefiles)
- Create Point Layer:
- Navigate to
Layer > Create Layer > New Shapefile Layer. - File name:
Utility_Poles.shp. - Geometry type:
Point. - Add attribute fields (Non-spatial setup): Name (Text/String), Height (Decimal/Real), Install_Date (Date). Click OK.
- Navigate to
- Create Line Layer:
- Navigate to
Layer > Create Layer > New Shapefile Layer. - File name:
Road_Network.shp. - Geometry type:
Line. - Add attribute fields: Road_Name (Text/String), Road_Type (Text/String), Width_m (Decimal/Real). Click OK.
- Navigate to
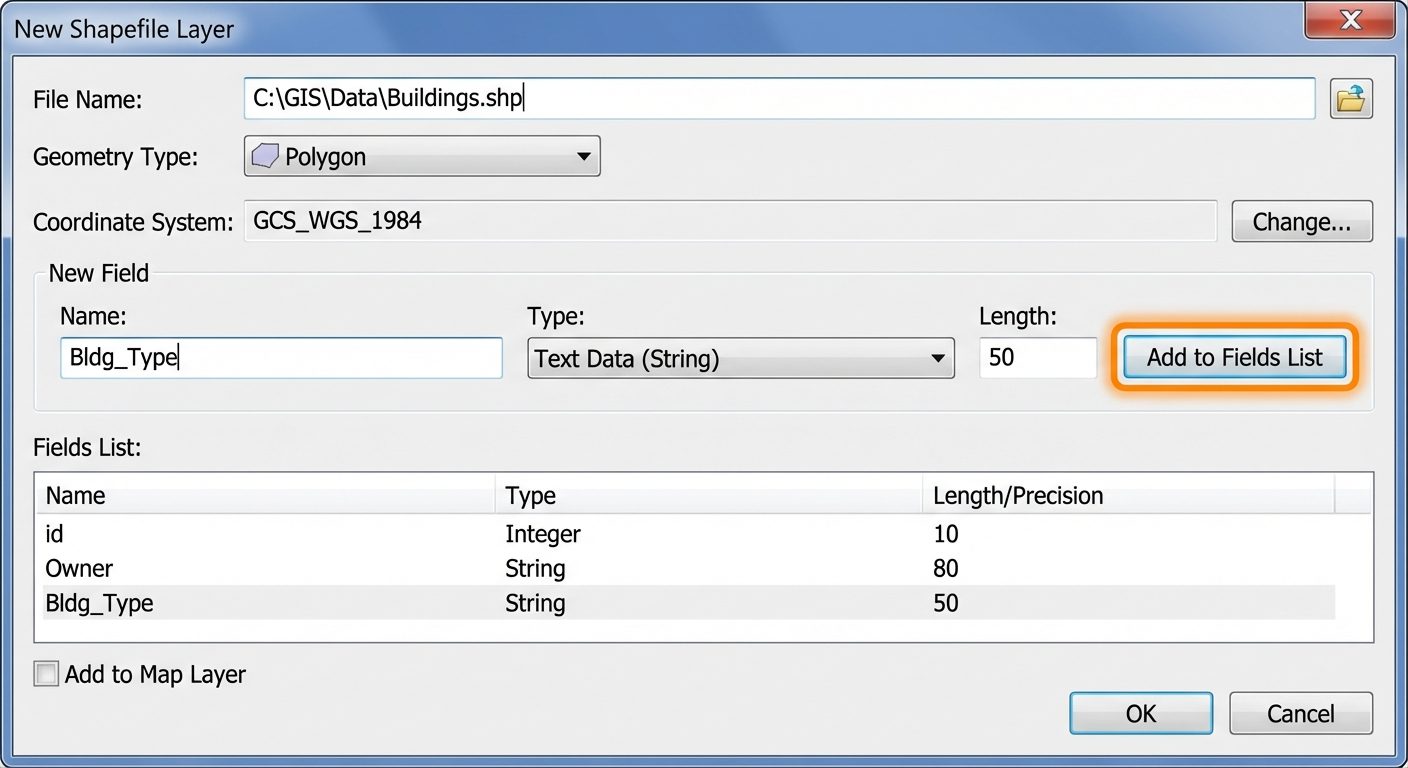
- Create Polygon Layer:
- Navigate to
Layer > Create Layer > New Shapefile Layer. - File name:
Building_Footprints.shp. - Geometry type:
Polygon. - Add attribute fields: Bldg_ID (Integer), Owner (Text/String), Use_Type (Text/String). Click OK.
- Navigate to
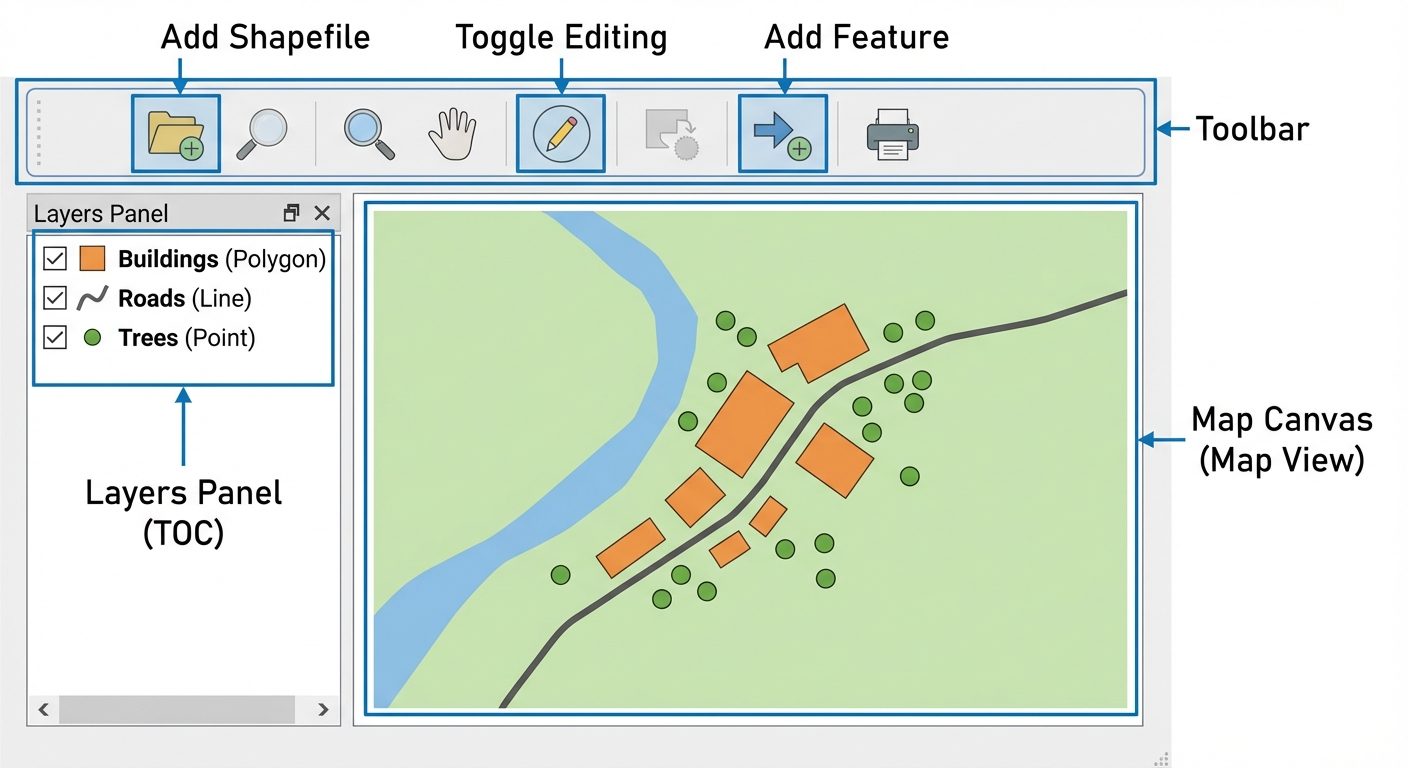
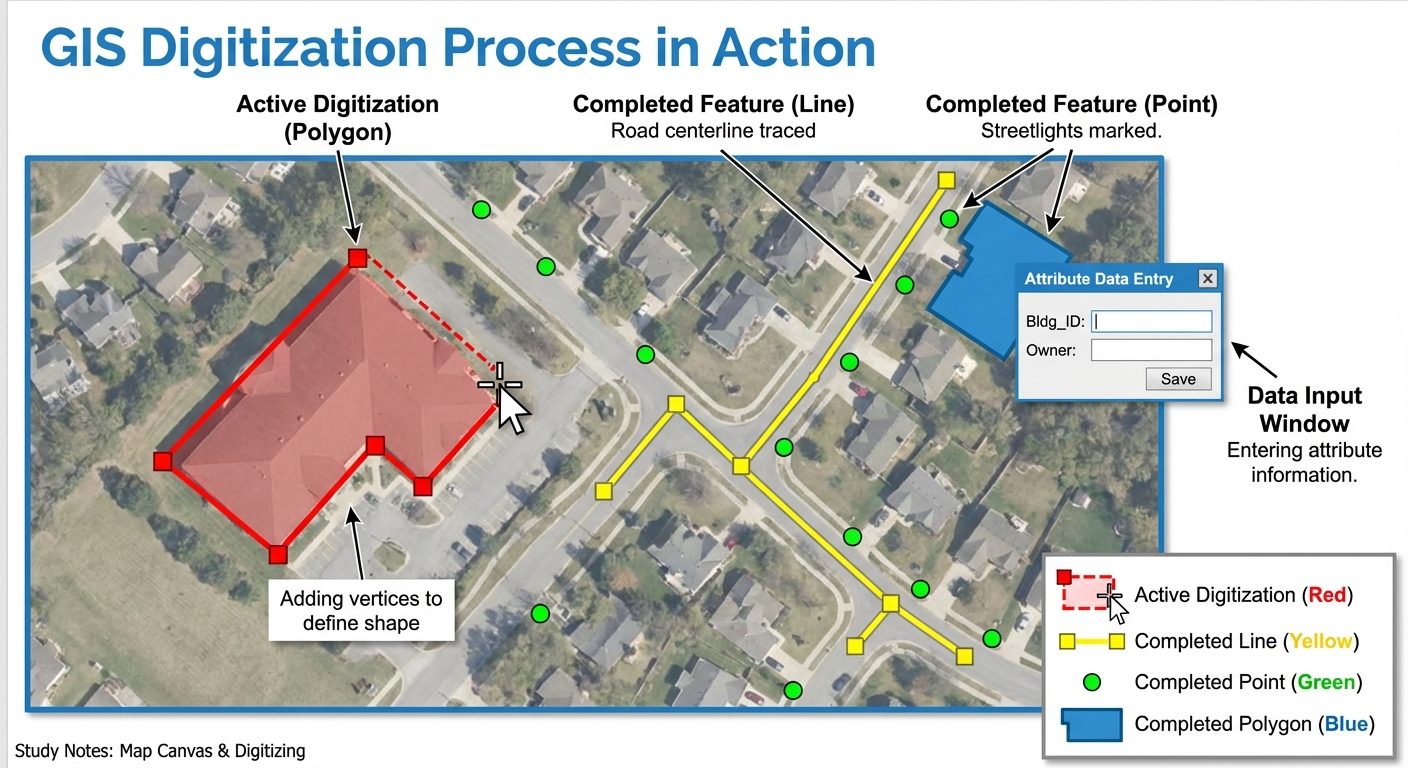
Step 5.3: Spatial Data Digitization
- Select the
Building_Footprintslayer in the Layers panel. - Click the
Toggle Editing(Pencil icon) to start an editing session. - Select the
Add Polygon Featuretool. - Left-click to trace the corners of a building visible on the base map. Right-click to finish the polygon.
- Immediately upon finishing the polygon, an attribute prompt will appear. Enter the non-spatial data (e.g., Bldg_ID: 101, Owner: "City Gov", Use_Type: "Commercial").
- Repeat this process for the
Road_Network(tracing lines) andUtility_Poles(clicking single points on the map). - Save layer edits frequently.
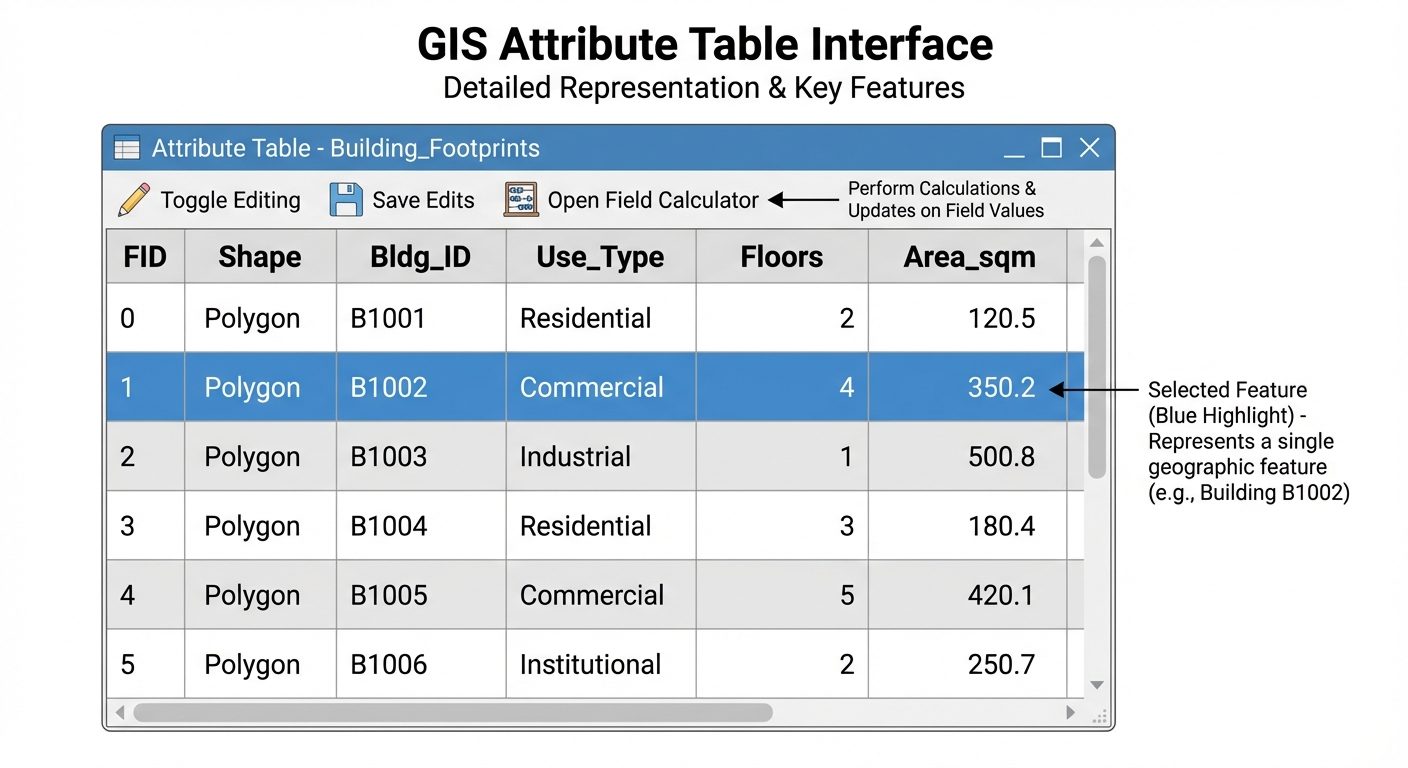
Step 5.4: Managing Non-Spatial Datasets
- Right-click any digitized layer in the Layers panel and select
Open Attribute Table. - Review the tabular data matrix where each row corresponds to a single spatial feature and each column represents an attribute field.
- Update or correct any missing data values manually within the table.
6. Observations / Truth Tables / Readings (Attribute Data Schemas)
Once digitization is complete, the non-spatial attribute tables serve as the "Truth Tables" of our geographic entities. Below are the structural observations of the created datasets:
Table 1: Point Feature Attribute Table (Utility_Poles.shp) |
Feature ID (FID) | Shape | Pole_ID (Int) | Condition (String) | Height_m (Real) |
|---|---|---|---|---|---|
| 0 | Point | 1001 | Good | 8.5 | |
| 1 | Point | 1002 | Requires Maintenance | 8.2 | |
| 2 | Point | 1003 | Good | 9.0 |
Table 2: Line Feature Attribute Table (Road_Network.shp) |
Feature ID (FID) | Shape | Road_Name (String) | Surface (String) | Lanes (Int) |
|---|---|---|---|---|---|
| 0 | Polyline | Main St. | Asphalt | 2 | |
| 1 | Polyline | Oak Lane | Concrete | 1 | |
| 2 | Polyline | Pine Ave. | Asphalt | 4 |
Table 3: Polygon Feature Attribute Table (Building_Footprints.shp) |
Feature ID (FID) | Shape | Bldg_ID (Int) | Use_Type (String) | Floors (Int) |
|---|---|---|---|---|---|
| 0 | Polygon | 501 | Residential | 2 | |
| 1 | Polygon | 502 | Commercial | 5 | |
| 2 | Polygon | 503 | Educational | 3 |
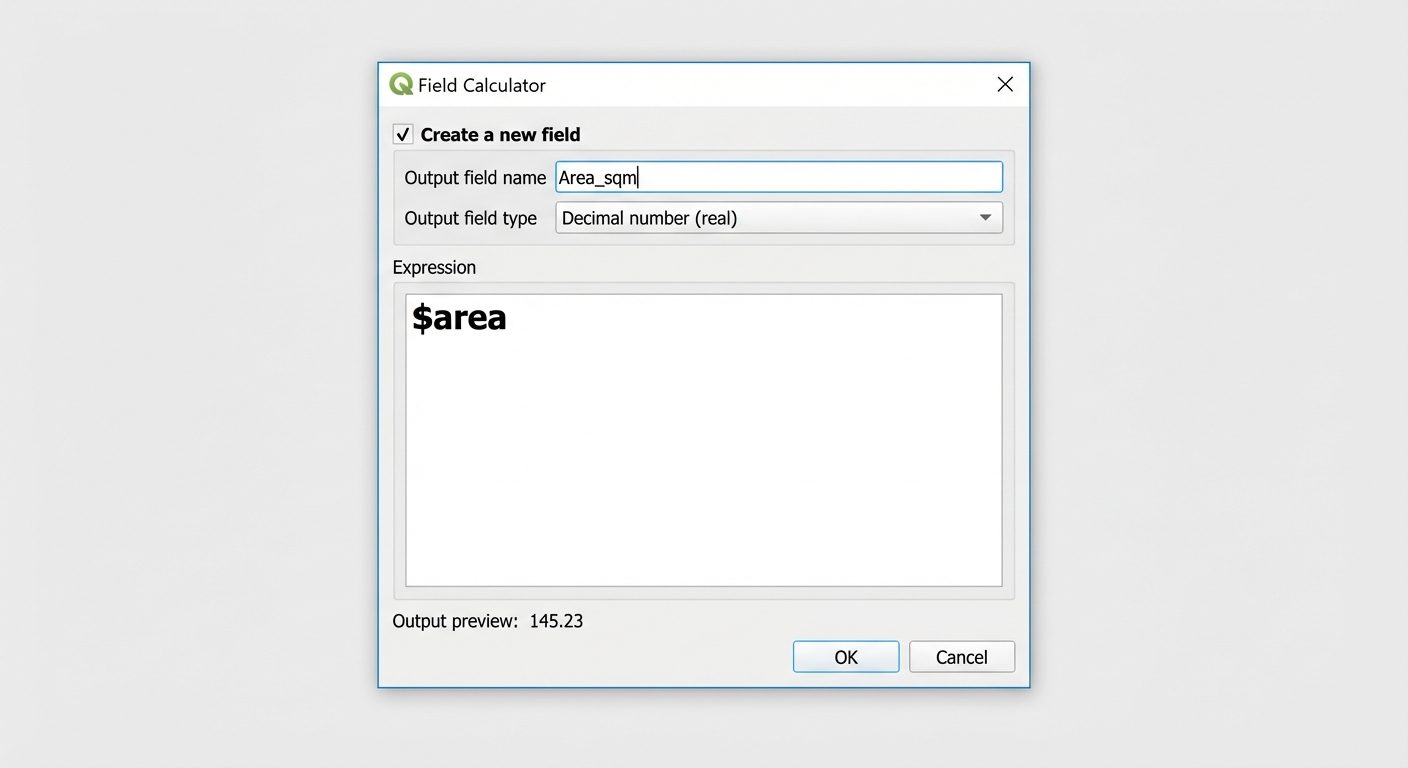
7. Calculations (Geometry Calculations)
In GIS, dimensional properties of digitized spatial data can be automatically calculated and added to the non-spatial dataset.
Procedure for calculating Polygon Area:
- Open the Attribute Table for
Building_Footprints. - Open the
Field Calculatortool. - Create a new field: Name =
Area_sqm, Type =Decimal number (Real). - In the expression box, type the geometry function:
$area - Click OK. The GIS calculates the precise area based on the map's coordinate system.
Procedure for calculating Line Length:
- Open Attribute Table for
Road_Network. - Open
Field Calculator. - Create a new field: Name =
Length_m, Type =Decimal number (Real). - Expression:
$length
Sample Calculation Observation:
- Building 501 Area = 145.23 sq meters
- Main St. Length = 850.45 meters
8. Result
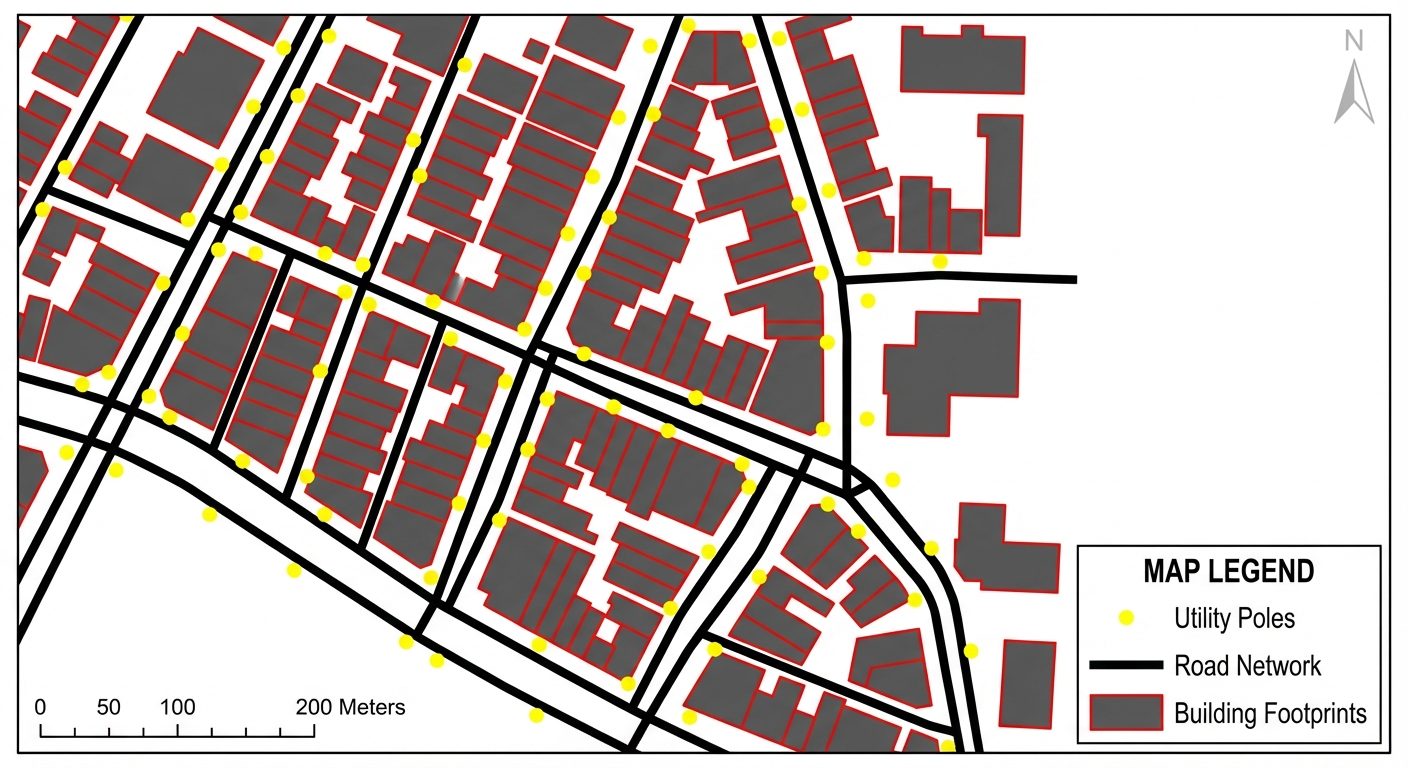
The data structure for large-scale mapping was successfully designed and implemented. Three distinct spatial data layers were created:
- Point spatial data representing point-based infrastructure.
- Line spatial data representing transport networks.
- Polygon spatial data representing area-based features.
Non-spatial attribute databases were successfully linked to these spatial geometries, allowing for geometry calculations (length and area) and structured query mapping.
9. Viva Questions
Q1. What is the difference between Spatial and Non-Spatial Data in GIS?
Answer: Spatial data represents the geometry and physical location of a feature on the Earth's surface (Coordinates, shapes). Non-spatial (attribute) data represents the descriptive characteristics or properties of those spatial features (Names, types, dimensions).
Q2. When should you use a Point, Line, or Polygon for spatial data?
Answer: Points are for discrete zero-dimensional objects (trees, wells). Lines are for 1-dimensional continuous objects with length but negligible width (roads, rivers). Polygons are for 2-dimensional enclosed areas having both length and width (buildings, lakes, administrative boundaries).
Q3. What is a "Shapefile"?
Answer: A shapefile is a popular geospatial vector data format for GIS software, developed by ESRI. It stores non-topological geometry and attribute information for spatial features in a data set.
Q4. Why do we need a Coordinate Reference System (CRS) before digitizing?
Answer: A CRS aligns the flat, 2D digitized data to a specific model of the 3D Earth. Without it, the map will lack real-world scale, location accuracy, and the ability to accurately calculate metrics like area and length.
Q5. What is the significance of "Large Scale Mapping" in this practical?
Answer: Large scale maps (e.g., 1:1,000) show a small geographical area in high detail. This requires precise digitization of highly granular features like individual building footprints and utility poles, which would be generalized or omitted in small scale maps.
Q6. What function is used in the Field Calculator to find the perimeter of a polygon?
Answer: In QGIS, the expression $perimeter is used to extract the perimeter length of a polygon geometry into the attribute table.