Unit 1 - Notes
Unit 1: Data Science & Big Data
1. Introduction to Data Science
Definition:
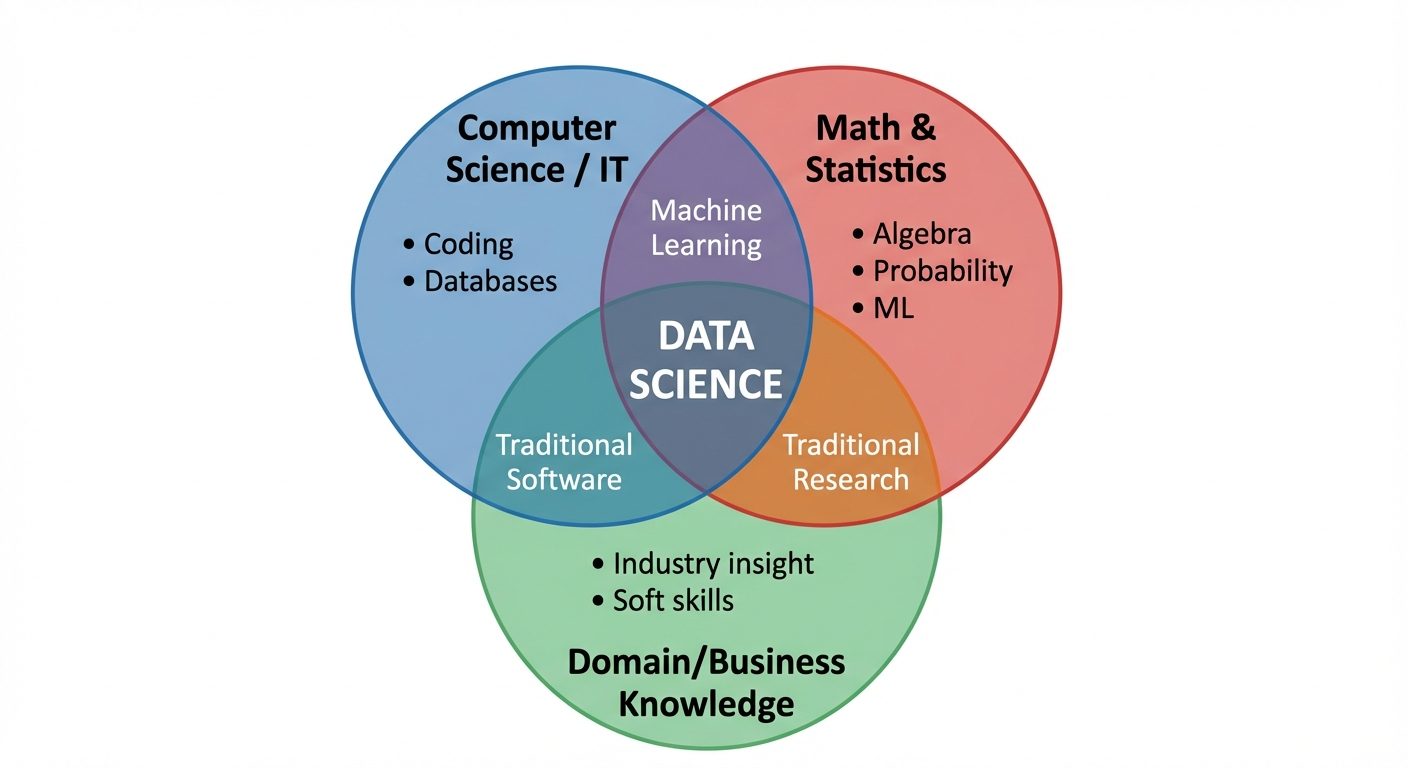
Data Science is an interdisciplinary field that uses scientific methods, processes, algorithms, and systems to extract knowledge and insights from noisy, structured, and unstructured data. It combines specific domain expertise, programming skills, and knowledge of mathematics and statistics to extract meaningful insights from data.
The Need for Data Science:
- Data Explosion: With the advent of the internet, IoT, and social media, the world generates approximately 2.5 quintillion bytes of data daily. Traditional tools cannot handle this volume.
- Decision Making: Companies need to move from intuition-based decisions to data-driven decisions to minimize risk and maximize profit.
- Pattern Discovery: It allows organizations to discover hidden patterns and trends (e.g., customer purchasing behavior).
- Competitive Advantage: Organizations utilizing data science can optimize operations and predict market trends faster than competitors.
2. Applications of Data Science & Big Data
Data Science changes how decisions are made across various sectors:
- Healthcare:
- Medical Image Analysis (detecting tumors in X-rays).
- Drug Discovery (simulating reaction to drugs).
- Predictive Medicine (forecasting disease outbreaks).
- Finance (FinTech):
- Fraud Detection (identifying suspicious transactions in real-time).
- Algorithmic Trading (automating stock trades based on market data).
- Risk Assessment (credit scoring).
- E-Commerce & Retail:
- Recommendation Engines (Amazon/Netflix "You might also like...").
- Inventory Management (predicting demand to manage stock).
- Transportation:
- Route Optimization (Google Maps).
- Self-driving cars (interpreting sensor data).
- Social Media:
- Sentiment Analysis (analyzing tweets/posts to gauge brand reputation).
- Targeted Advertising.
3. Data Science Lifecycle with Use Case
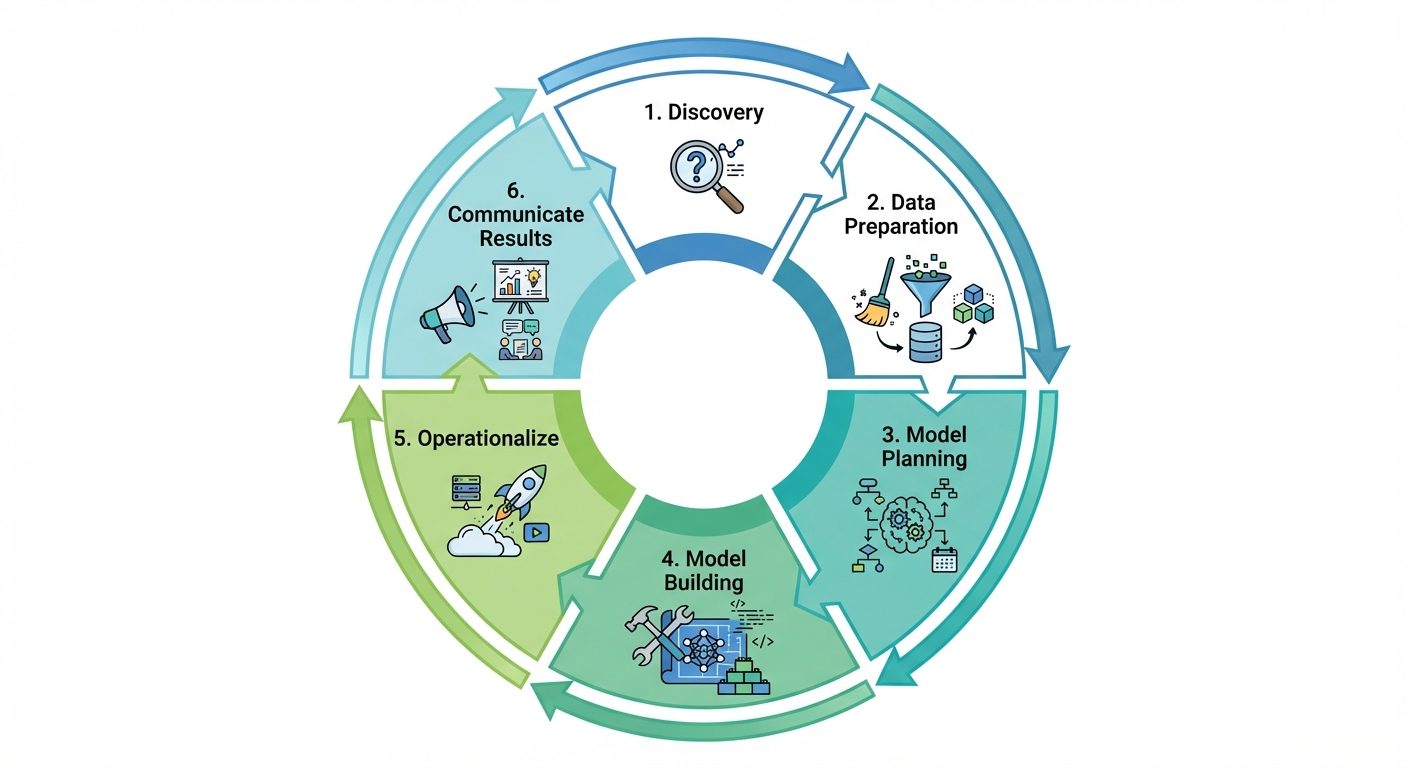
The Data Science Lifecycle typically consists of six main phases.
Use Case: Customer Churn Prediction for a Telecom Company
(Goal: Identify customers likely to cancel their subscription)
- Discovery:
- Objective: Define the problem.
- Action: Business leaders ask: "Why are we losing customers?" and "Who will leave next month?"
- Data Preparation (Data Cleaning):
- Objective: Gather and clean raw data.
- Action: Extract call logs, payment history, and complaint logs. Handle missing values (e.g., null entries for age) and remove duplicates.
- Model Planning:
- Objective: Determine methods and techniques to draw relationships between variables.
- Action: Select algorithms (e.g., Logistic Regression or Decision Trees) suitable for binary classification (Churn vs. No Churn).
- Model Building:
- Objective: Develop datasets for training and testing.
- Action: The team runs the model on historical data. The model learns that "High Complaints + Late Payment = High Probability of Churn."
- Operationalize:
- Objective: Deliver final reports, code, and technical documents.
- Action: Deploy the model into the real-time CRM system.
- Communicate Results:
- Objective: Present findings to stakeholders.
- Action: Visualize the data showing that a 10% discount to high-risk customers reduces churn by 20%.
4. Big Data and its 3Vs
Definition:
Big Data refers to datasets that are too large or complex for traditional data-processing application software to deal with. It implies data that exceeds the processing capacity of conventional database systems.
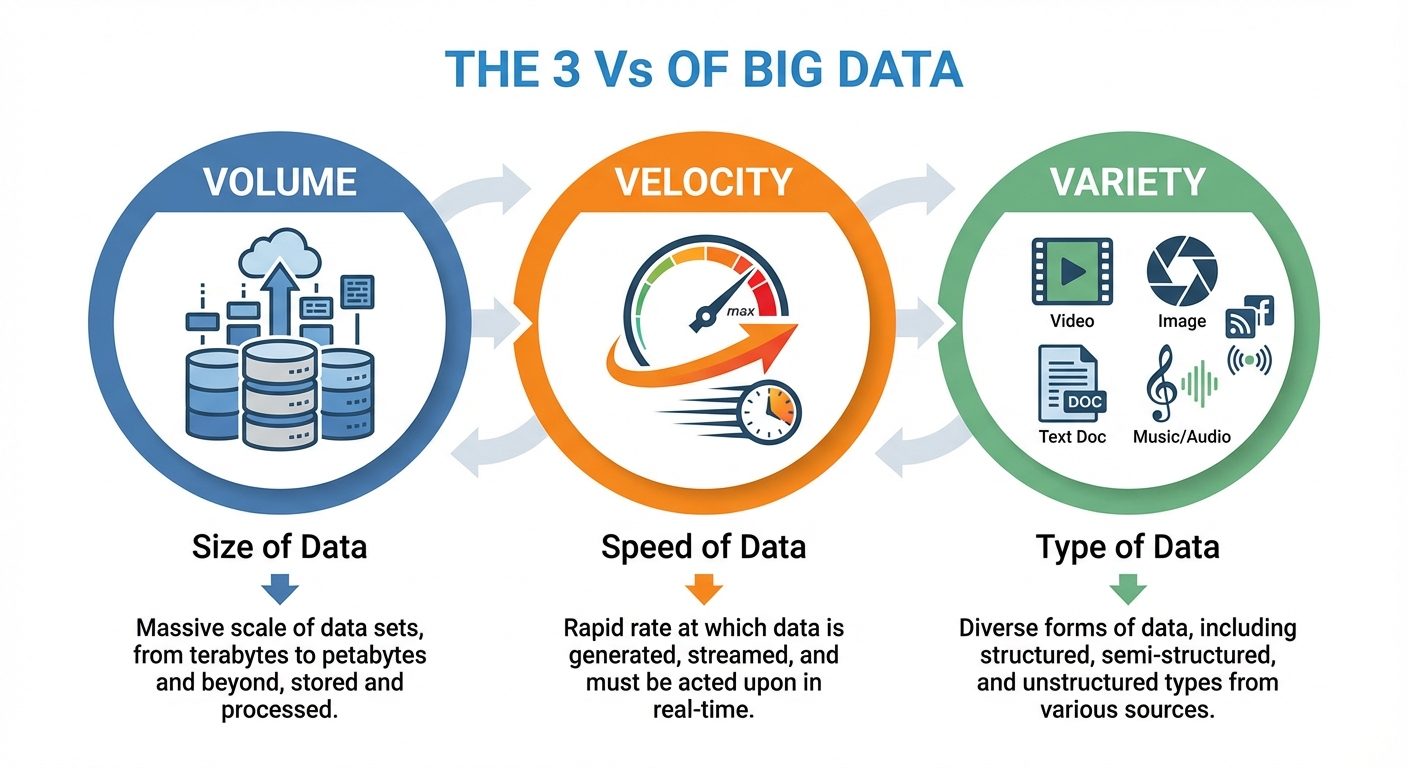
The 3 Vs of Big Data:
- Volume:
- Refers to the sheer size of the data.
- Scale: Terabytes (TB), Petabytes (PB), and Zettabytes (ZB).
- Source: Transaction logs, IoT sensors, video streams.
- Velocity:
- Refers to the speed at which data is generated and processed.
- Requirement: Real-time processing is often needed.
- Example: 6,000 tweets per second; Stock market ticks.
- Variety:
- Refers to the different types of data.
- Structured: SQL databases (Rows and Columns).
- Semi-structured: XML, JSON, CSV.
- Unstructured: Audio, Video, Images, PDF files, Emails.
(Note: Modern definitions often add Veracity (uncertainty/quality of data) and Value (business worth) to make it 5Vs).
5. Challenges of Big Data
- Storage: Storing petabytes of data requires massive infrastructure (Data Centers) which is expensive and hard to manage.
- Processing Power: Traditional processors cannot process such volumes quickly. Parallel processing (clusters) is required.
- Data Security & Privacy: Protecting sensitive user data (PII) in massive datasets is difficult, especially with GDPR/CCPA regulations.
- Data Quality (Veracity): Big data is often messy, incomplete, or inconsistent. Cleaning it takes 60-80% of a data scientist's time.
- Skill Shortage: There is a global gap between the demand for Big Data professionals and the available talent pool.
6. Skills Needed for Big Data
To work effectively in this domain, professionals need a mix of Technical (Hard) and Soft skills:
- Programming: Python (most popular for Data Science), R (Statistics), Java/Scala (for Hadoop/Spark), SQL.
- Database Management: Knowledge of SQL (MySQL, PostgreSQL) and NoSQL (MongoDB, Cassandra).
- Big Data Frameworks: Understanding Apache Hadoop, Spark, Hive, and Pig.
- Mathematics & Statistics: Linear algebra, calculus, probability, and statistical testing.
- Machine Learning: Supervised/Unsupervised learning algorithms.
- Data Visualization: Storytelling with data using Tableau, PowerBI, or Matplotlib.
7. Tools Usage
Apache Hadoop
- Purpose: An open-source framework for distributed storage and processing of big data.
- Core Components:
- HDFS (Hadoop Distributed File System): Splits files into blocks and stores them across multiple nodes (redundancy for safety).
- MapReduce: A programming model for processing large data sets in parallel.
- YARN: Resource negotiator/manager.
Tableau
- Purpose: Business Intelligence (BI) and Data Visualization.
- Usage: Drag-and-drop interface to create interactive dashboards. Connects to almost any database (Excel, SQL, Cloud). Used for reporting and decision-making by non-technical stakeholders.
R Language
- Purpose: Statistical computing and graphics.
- Usage: Heavily used in academia and research for heavy statistical analysis. Excellent for data mining and creating complex statistical models (linear/non-linear modeling).
Excel
- Purpose: Spreadsheet calculation and basic data analysis.
- Usage: The entry-level tool for data analysis. Useful for Pivot Tables, VLOOKUP, and handling small to medium datasets (up to ~1 million rows).
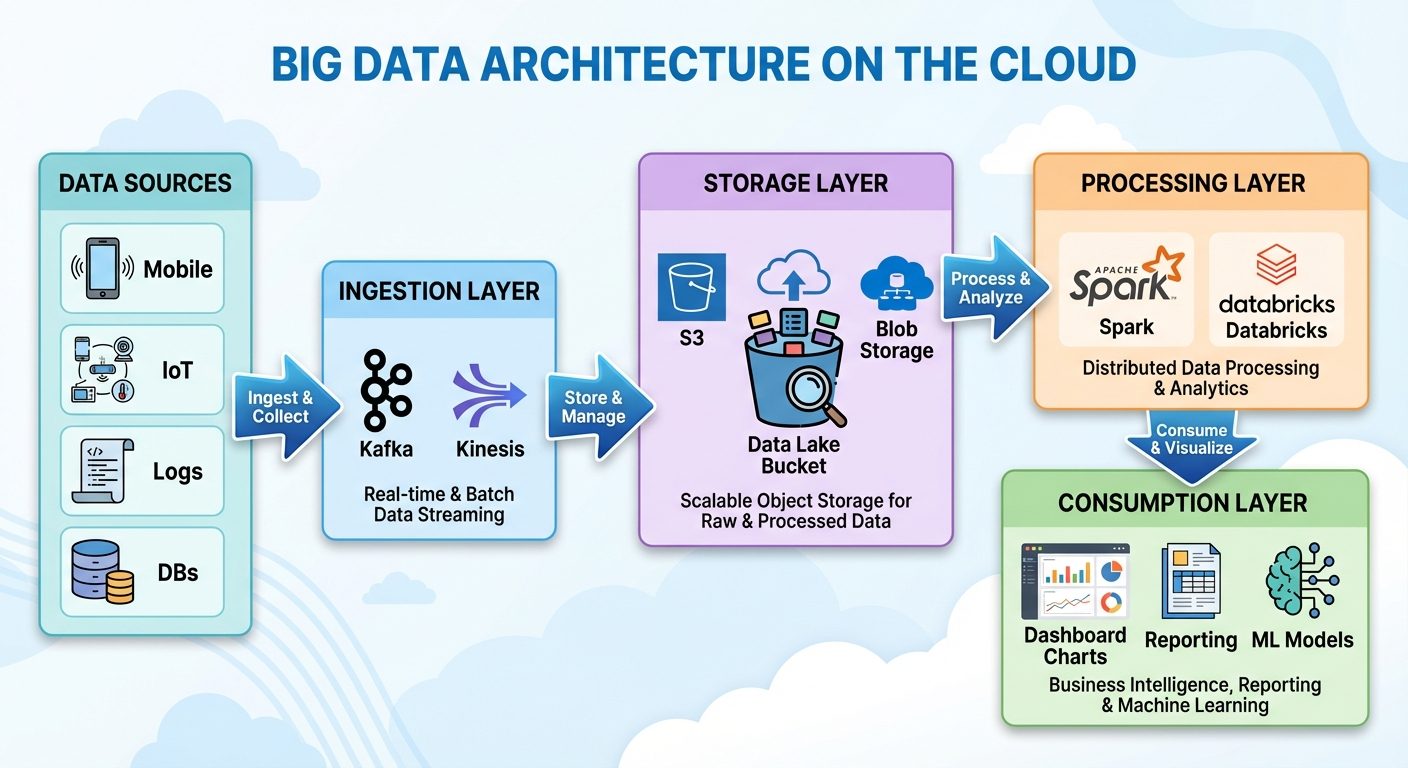
8. Big Data on the Cloud
Moving Big Data from "On-Premise" (local servers) to "Cloud Computing" is the industry standard.
Why Cloud for Big Data?
- Scalability: Instantly scale up storage/RAM during peak loads and scale down when not needed.
- Cost Efficiency: "Pay-as-you-go" model avoids upfront capital expenditure on hardware.
- Managed Services: Cloud providers handle maintenance, security patching, and backups.
Major Cloud Providers & Big Data Services:
- AWS (Amazon): Amazon EMR (Elastic MapReduce), Redshift (Data Warehousing).
- Microsoft Azure: Azure HDInsight, Azure Databricks.
- Google Cloud Platform (GCP): BigQuery (Serverless data warehouse), Dataflow.
9. Job Roles and Skillsets
The data ecosystem has distinct roles, often confused but with different responsibilities.
| Job Role | Primary Focus | Key Skills Required |
|---|---|---|
| Data Analyst | Analyzing historical data to answer specific business questions. | Excel, SQL, Tableau/PowerBI, Basic Statistics. |
| Data Scientist | Predicting future trends, building ML models, advanced analysis. | Python/R, Machine Learning, Deep Math/Stats, Data Wrangling. |
| Data Engineer | Building the pipeline/architecture to collect and store data. | SQL, NoSQL, Hadoop, Spark, Cloud (AWS/Azure), Java/Scala, ETL pipelines. |
| Big Data Architect | Designing the overall system structure and technology stack. | System Design, Cloud Architecture, Security, Database theory. |